
 Minter
 Quack AI
 NEAR Protocol
 Sui
Sui Hyperliquid
 Cardano
 Raydium
- The SHI stock does not pay any dividends to its shareholders.
- The SIG Plc stock has given a return of nearly -5% in the last six months.
- SIG Plc’s technical indicators summary gives a ‘sell’ signal.
SIG Plc (LON: SHI) is involved in providing specialized building solutions to its clientele in the trades industry. The company’s product range encompasses items such as insulation and interior products, roofing and exterior products, as well as solutions for air handling.
Currently, SHI stock exhibits a downtrend pattern with successive lower lows.
The stock is trading at GBX 31.55, experiencing a 4% decline in today’s market session. It boasts a trading volume of 1.7 Million shares with a share float of 652 Million.
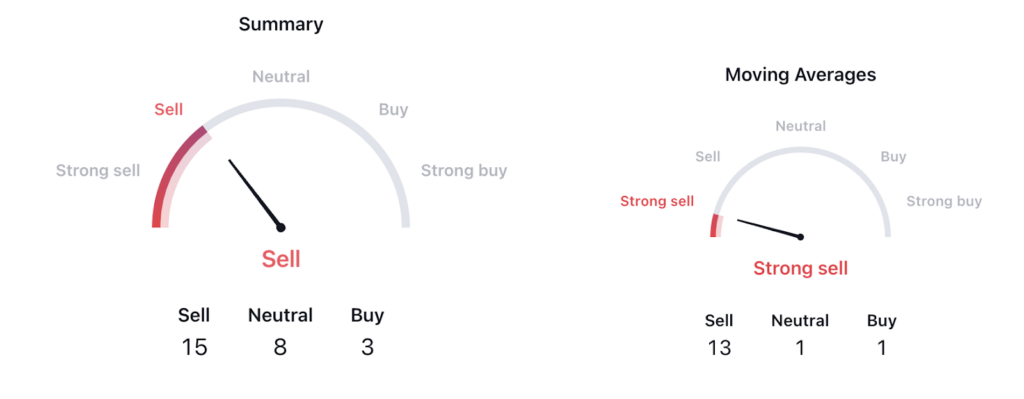
Analyzing the technical indicators, SHI stock receives a ‘sell’ signal. Among the top 26 indicators, 15 suggest selling, and only 3 indicate buying. Furthermore, the moving averages summary strongly suggests selling this stock, indicating a weak trend.
It’s worth noting that SHI stock doesn’t provide dividends to its shareholders, which could deter income-focused investors.
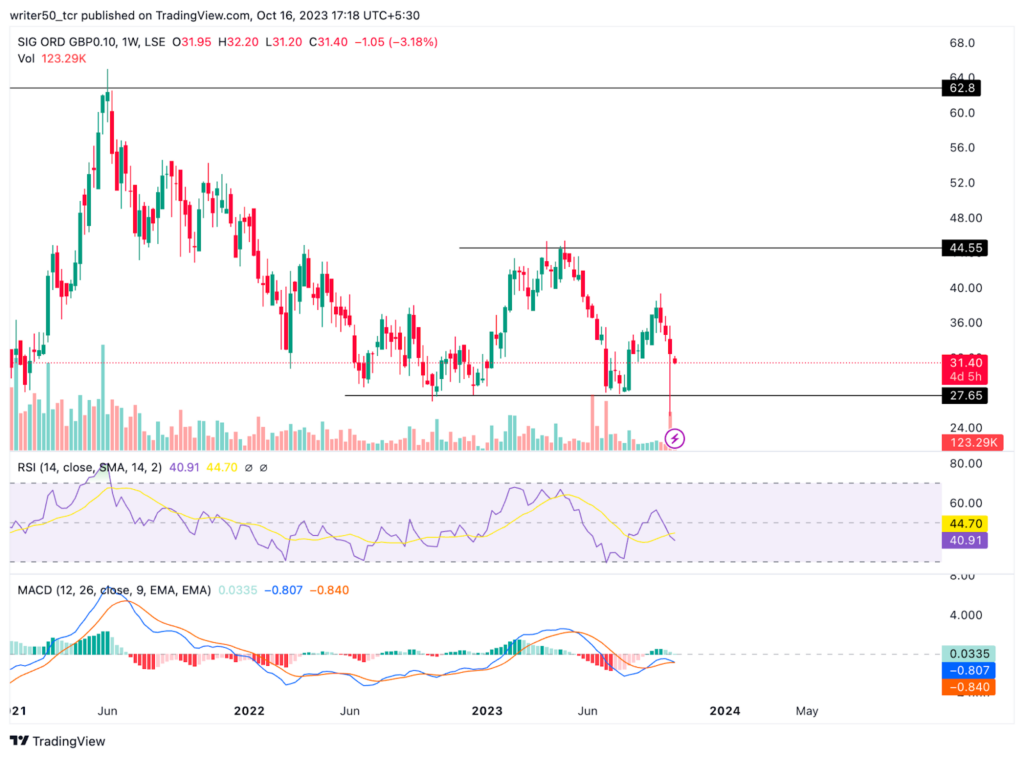
Historically, SHI stock reached its peak at GBX 1162 in 2007, after which it entered a prolonged decline, resulting in a significant loss of over 98%. In 2020, the stock found support at the GBX 16 level and displayed a minor recovery. Currently, the stock is moving within a range and is forming a bearish pattern, suggesting potential future declines, given the overall negative structure of the stock.
SIG PLC (SHI) Stock Price Analysis
Source: SHI /USD.1D.TSX by TradingView
Technical Indicators Summary:
At the moment, both the RSI line and the SMA line for SHI stock are situated near the 40 level, signifying a bearish phase. This implies the potential for a price decline in in the near future.
Moreover, the MACD line for SHI stock has recently witnessed a bearish crossover, with the signal line surpassing the MACD line. This development serves as a bearish signal, indicating the likelihood of the stock price descending to lower levels in the days ahead.
SHI Stock Chart ByTradingView.com
Conclusion
According to the analysis, SHI stock is presently in a downtrend, with the price declining after reaching a peak. Additionally, the stock has given a negative return in recent months. The overall outlook for SHI stock is negative, with the price following a negative pattern. Consequently, it’s probable that the price will decline in the coming days.
Technical Levels
- Support Level: GBX 27
- Resistance Level: GBX 44
Disclaimer
The views and opinions of the author, or anyone named in this article, are for informational purposes only. They do not offer financial, investment, or other advice. Investing or trading crypto assets involves the risk of financial loss.




