
 Pearl
Pearl Bitcoin
 NEAR Protocol
 Starknet
 Solana
 Quant
Quant Ondo
Ondo
- The NG stock price is currently trading at 979.4 GBX with an intraday gain of 1.53%.
- The price is currently retesting the 50-day EMA.
National Grid Plc (LSE: NG) is a British electricity and gas utility corporation. It supplies electricity and gas to its customers and communities. It operates through segments such as UK Electricity Transmission, UK Electricity Distribution, UK Electricity System Operator, New England, and New York.
National Grid (NG) Stock Analysis
National Grid’s share price closed its last intraday session with a gain of 1.53%. Its stock price is currently trading at 979.4 GBX. Being a large-cap company, National Grid Plc has a market capitalization of 35.567 Billion GBP.
NG. Stock 1-Day Chart Analysis
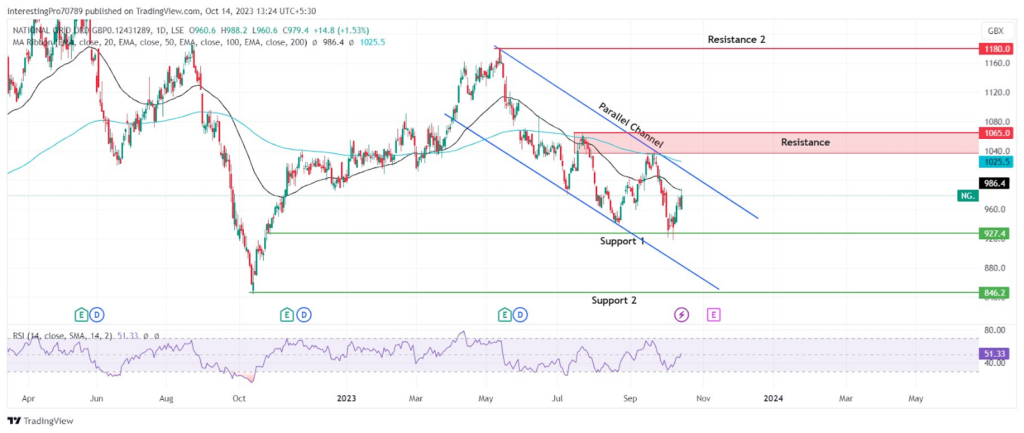
The NG share price is currently trading inside a falling parallel channel. It has recently taken support from the 927.4 GBX and is commencing a bullish rally. The price has gained around 5.45% since it has taken support from the 927.4 GBX level.
In the last trading session, the price tried to break above the 50-day EMA line (black line) but failed to do so. It faced rejection from a 50-day EMA but did not let the sellers take full control of the price. The candle formed after facing rejection from the 50 EMA line was a strong bullish candle.
Therefore, buyers still have a chance to reclaim the 50-day EMA in the upcoming trading session. However, the 50 and 200-day EMA lines are trading above the price, showing sellers are still influencing the price.
The RSI line is just above its 50 level and is trending in the upward direction. It shows the high buying pressure currently going on and has more room in the upward direction for the price to rise.
If the NG stock price reclaims the 50-day EMA, the price might rise and test the 200-day EMA. For the bulls to take full control over the price, they must have to give the breakout of the 1065 GBX. Thus, the price may rise to its next resistance at 1180 GBX.
If the next candle closes below the current green candle, the price might fall back to its 927.4 GBX support. For the price to continue its bearish trend, it must give the breakdown of the 927.4 GBX support level. After that, the NG share price may fall to its next support at 846.2 GBX.
Conclusion
The overall trend of the NG. stock price is bearish. The price faced rejection from the 50-day EMA in the last trading session. If the next candle closes below the current candle, it may fall to retest the 927.4 GBX support. For the price to continue its overall bearish trend, it must have to give the breakdown of the 927.4 GBX support. It is how the NG share price may continue its fall to 846.2 GBX support.
However, the RSI is showing high buying pressure due to which it is trending in the upward direction. If the next two to three candles reclaim the 50-day EMA, the price may continue to rise. However, there is an immediate resistance of 1065 GBX, which can restrict the further rise in price. So, it should give the breakout of this level after which it could continue its uptrend to 1180 GBX.
Technical levels
Resistance Levels: 1065 GBX and 1180 GBX.
Support Levels: 927.4 GBX and 846.2 GBX.
Disclaimer
The views and opinions stated by the author or any other person named in this article are for informational purposes only. They do not provide financial, investment, or other advice. Investing or trading comes with a risk of financial loss.




