
 Pearl
Pearl Puffer
 NEAR Protocol
 ZKsync
 Bitcoin
 Solana
 Starknet
- Avacta loss increases with rising costs, yet clinical tests come out OK.
- The current market price of the AVCT stock is GBX- 140.2. The market capitalization of the AVCT share in October 2023 is £375.566 million.
- Let’s assess the AVCT stock price movement through technical indicators and fundamental analysis.
Avacta Group Plc provides reagents and medicines based on Affimer technology for diagnostic and research applications in the UK, North America, Asia, and the rest of Europe. Avacta Group (AVCT) was founded by Alastair Smith in 2003. Its stock has been listed on the London Stock Exchange.
Live Chart of AVCT
The AVCT Stock Analysis from the Basics
Avacta Group Plc (AVCT) exhibits weak fundamentals. In 2022, the company incurred an Operating Loss of £25.49 million and managed a decrease of £3.56 million from the year 2021. In 2022, the company generated £39.50 million in Net Loss, more than £13.18 million from the financial year 2021. Furthermore, its Gross Loss for 2022 was £4.23 million, once again significantly an incline of £6.73 million in the gross profit compared to the 2021 year. The total revenue for 2022 increased to £9.65 million. It is a rise of £6.71 million from the last year.
Technical Index of AVCT (50, 100, 200)
Exponential Moving Average
- The EMA 100- GBX- 117.9 (Buy)
- The EMA 200- GBX- 117.3 (Buy)
Simple Moving Average
- The SMA 100- GBX- 111.2 (Buy)
- The SMA 200- GBX- 122.9 (Buy)
The Technical Analysis of AVCT
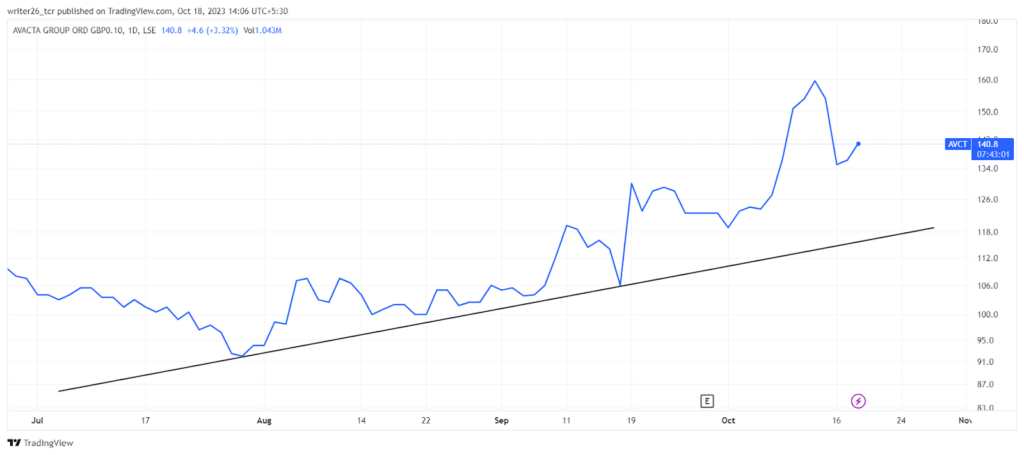
The all-time high in AVCT stock was made on February 23, 2023, which was around GBX- 187.8. As we can see in the image, the AVCT stock has been trending upward since August 2023.
Today AVCT stock is up by 2.86%. Therefore, the AVCT share increased by 3.80 GBX. As we can see, the AVCT stock began to go in an upward momentum. Since August 2023, it has been moving in the same pattern.
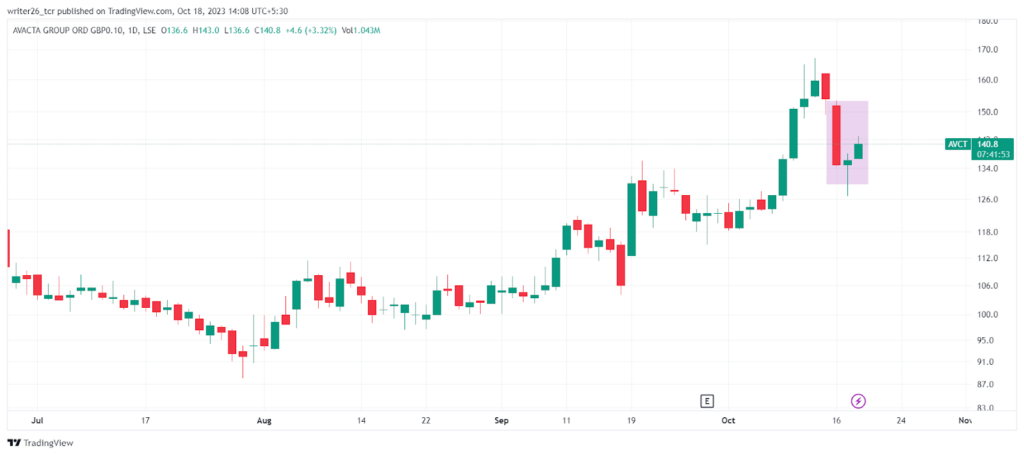
The design in the box is known as “Morning Star Formation”. It implies that the price will continue to incline over a day. This pattern develops while the price is falling and predicts that the AVCT stock price could increase.
Conclusion
We may infer from the data that AVCT stock is doing well each trading day, it is suitable for short-term investment due to the uptrend momentum. It might continue its upward momentum in the future.
It might continue its uptrend trend in the future, it declined by 9.61% throughout the 5-D period. Last month, the AVCT stock price increased by 21.09%. The price rose by 40.71% last year. It might continue to rise daily in the future. Last 6 months, AVCT stock grew by 6.30%. Additionally, in the last 5 years, AVCT stock was boosted by 489%.
Technical Levels
- Support level- GBX- 137.6
- Resistance level- GBX- 98.8
Disclaimer
This is a general article that does not provide any financial information. Investors should focus on both technical analysis as well as fundamental analysis. The analysis is done to provide information to readers. To make them aware of investments. All the data is fluctuating due to stock market hours. It might change when readers read the article.



