
 streamoors
 IGNITION
 Injective
 Quantus
 NEAR Protocol
 Pearl
Pearl LayerZero
- Advanced Micro Devices Inc.’s annual profit margin has shown a huge decline.
- The AMD stock’s MACD indicator has formed a red histogram.
- Advanced Micro Devices Inc (AMD) has a share float of 1.5 Billion shares.
The price of Advanced Micro Devices (NASDAQ: AMD) is following a downward trajectory as it consistently establishes lower lows within the weekly timeframe.
The AMD stock is currently trading at $104. It has an average trading volume of $49 million and a share float of 1.5 Billion shares.
The AMD stock reached a high of $164.4 in November 2021 after this the price started falling. The price fell by almost 65%. However, it identified a critical support level at $54, which triggered a notable reversal in its trajectory. Since then, the stock has made an impressive recovery, marking an astonishing surge of 142% from its lowest point.
At the moment, the AMD stock is engaged in a falling wedge pattern, which is generally viewed as a bearish pattern. The overall structure of the stock exhibits signs of weakness, hinting at a potential price decline in the days ahead.
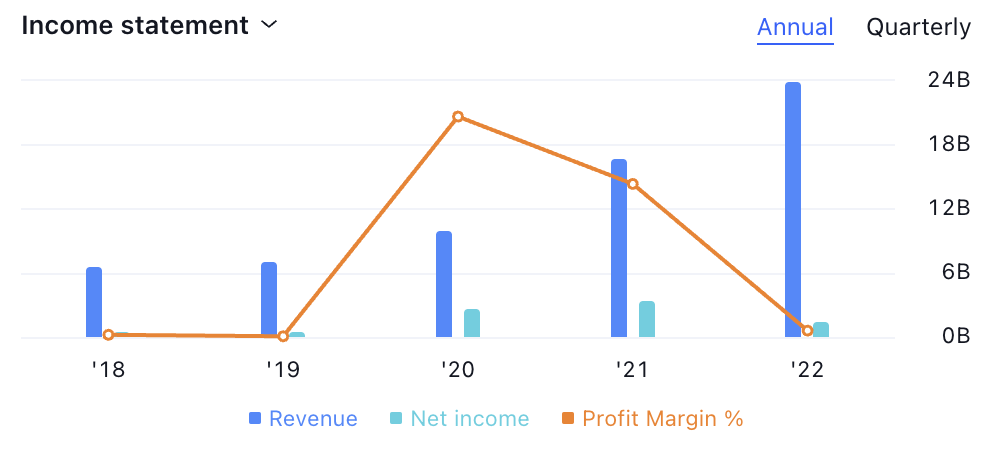
The annual profit margin percentage for the AMD stock has witnessed a substantial decline. In 2020, the profit margin was at 25.5%, but it declined to around 5.5% by the end of 2022. This substantial decline in profit margin reflects a vulnerability in the stock’s price. It may deter prospective buyers from establishing positions.
Advanced Micro Devices (AMD) Stock Price Analysis
AMD by writer50_tcr on TradingView.com
In the weekly time frame, Advanced Micro Devices’ MACD line is positioned beneath the signal line, signaling a bearish trend. Additionally, the presence of red histograms further reinforces this bearish indication.
The market momentum of the Advanced Micro Devices stock appears weak. As indicated by the stock’s current position, with the 14-day SMA line situated above the RSI line. This configuration suggests the potential for a decrease in the stock’s price in the coming days.
According to the charts, the AMD stock volume is gradually decreasing. It is encouraging and favorable for the downward trend of the stock price. It increases the probability of a price decline in the future.
Conclusion
In conclusion, the AMD stock is moving inside a falling wedge pattern. It is considered a weak pattern. Also, the earnings of the stock are declining and the indicators are giving a negative signal. Thus, the price is likely to decline in the future.
Technical Levels
- Support Level– $95
- Resistance Level– $108
Disclaimer
The views and opinions of the author, or anyone named in this article, are for informational purposes only. They do not offer financial, investment, or other advice. Investing or trading crypto assets involves the risk of financial loss.



