
 Quack AI
 Lighter
 NeoSoul
 Pearl
Pearl Quant
Quant Injective
 Pons
Pons
- Bank of America Corporation’s technical indicator summary shows a ‘sell’ signal.
- Bank of America Corporation’s ROIC declined over -68%.
- BAC has reported a decline in profit margin percentage.
The Bank of America Corporation (NYSE: BAC) functions as a financial institution and holding company, specializing in delivering a range of banking and nonbanking financial services. Its operations are categorized into distinct segments, namely Consumer Banking, Global Wealth and Investment Management (GWIM), Global Banking, and Global Markets.
The BAC stock price is presently exhibiting a downward momentum, marked by the emergence of a pattern featuring lower lows.
Over the course of the past year, BAC stock has witnessed a decline of approximately -21%. This decline in value projects a negative perception of the company among investors, potentially reducing their interest in establishing new positions.
As of the most recent market session, BAC stock is trading at $27.55, reflecting a 0.25% decline. The Return on Invested Capital (ROIC) for BAC stock in Q2 2023 stands at 8.1%, signaling a substantial YoY decline of 68.4%. This decline underscores the stock’s weak performance.
In February 2022, BAC stock reached its all-time peak at $50.11, after which it commenced a downward trajectory, resulting in a notable decrease of over 45%. However, the stock found support at around $26. The price movement of BAC stock has taken on the form of a descending triangle pattern, a configuration typically associated with a bearish trend.
Currently, the stock is positioned close to a critical support level. A breach of this support level could potentially lead to a significant decline in the days ahead.
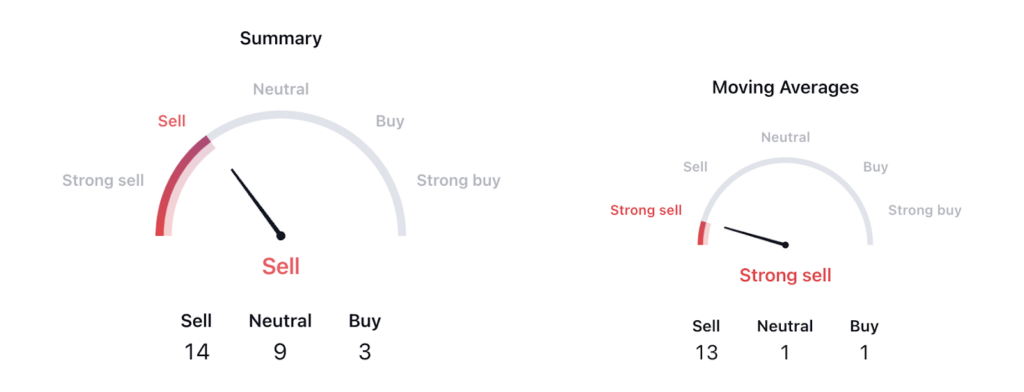
According to the technical indicators summary, there is a prominent “sell” signal for the stock. Out of a total of 26 indicators, 14 are signaling a “sell,” while the remaining 9 maintain a neutral stance, with 3 indicating a “buy” signal. This collective data underscores the overall weakness in the stock’s current status.
Bank of America Corporation (BAC) Stock Price Analysis
BAC by writer50_tcr on TradingView.com
Technical Indicators’ Overview
The RSI line has transitioned below the neutral range, with its position falling below the SMA line. This setup signifies a prevailing negative momentum in the stock, hinting at a potential further decline in the price.
Additionally, the MACD line is currently situated below the zero line, denoting a negative zone. Furthermore, the signal line maintains a position above the MACD line, adding further weight to the negative signal. Consequently, it is anticipated that the price will experience a decline in the days to come.
Conclusion
In summary, BAC stock has exhibited a negative momentum over the past year. Furthermore, the overall chart pattern for the stock is negative, and the indicators are also indicating a weak signal. Consequently, the price is currently in a downtrend and is expect to experience a decline in the days ahead.
Technical Levels
- Support Level: $26.3
- Resistance Level: $32.38
Disclaimer
The views and opinions of the author or anyone in this article are for informational purposes only. They do not offer financial, investment, or other advice. Investing in or trading crypto assets involves the risk of financial loss.
Meta keyword: BAC stock, BAC price, BAC stock price, Bank of America Corporation stock, Bank of America Corporation price prediction.




