
 Quack AI
 Pons
Pons Lighter
 Sui
Sui NEAR Protocol
 NeoSoul
 Quant
Quant
- The revenue of the company has suddenly advanced since the year 2020.
- ZM Stock is following a strong downtrend on the stocks.
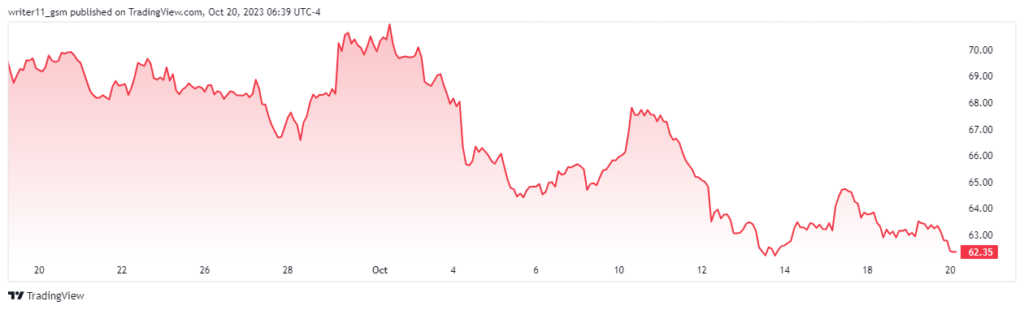
Zoom Video Communications Inc. is an American communications technology company and has its headquarters in San Jose, California. The company works in packaged software industry and the current CEO of the company is Eric S. Yuan. It was founded in the year 2011 and has more than 8K employees.
The ZM stock has a beta of 1.68 which makes its returns more volatile than the overall market. Currently, it has 222.54M shares floating in the market. The stock has a very huge PE ratio of 139.75 which indicates that the stock is overvalued.
The market cap of ZM stock is $18.555B and is trading with an average volume of 2.708M in the last 10 days. The company does not give any dividends to its shareholders.
Zoom Video communications Inc. Stock Performance Analysis
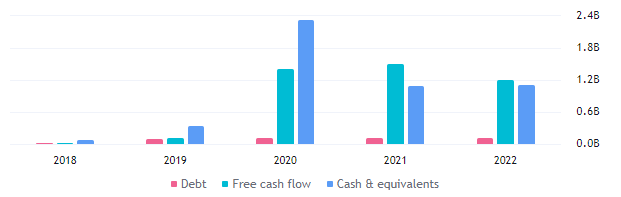
The revenue of Zoom Video Communications Inc. has advanced to $4.39B in the year 2022 from $4.10B in the year 2021. Despite this advance in revenue, the profit margin has witnessed a huge decline from 33.54% in the year 2021 to 2.36% in the year 2022. Zoom Videocommunications Inc. has managed its debt very well over the years and it has been consistently declining for the last two years.
Analyst Rating For ZM Stock
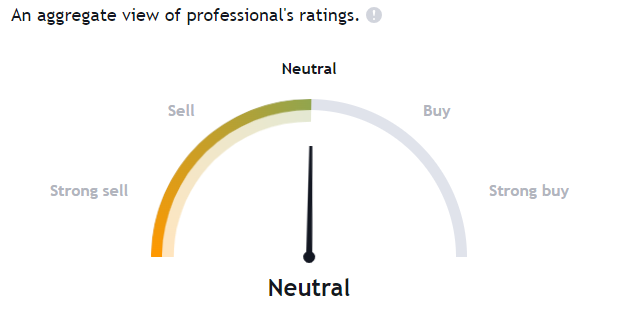
The experts as per Tradingview are neutral on the stock as seven experts are giving a buy rating while the rest 24 analysts are recommending holding the stock. Also one of the analysts is pessimistic about the stock recommending a sell in the stock.
ZM Stock Breaks Below The Rising Wedge Pattern
a by writer11_gsm on TradingView.com
The share price of the ZM stock has currently broken down below the rising wedge pattern which denotes the dominance of sellers in the trend of the stock. The share price is currently making bearish candlesticks and is forming new lows on the charts.
The EMAs such as the 50-day and the 200-day EMA are trading in a death cross followed by a decline in the price of the stock. The 50-day EMA is trading 8% farther from the 200-day EMA. This denotes the length of the trend.
The RSI for the LUV stock is also trading in bearish zones declining to lower levels. It is currently trading at a level of 34.84.
Conclusion
Despite the bearish price action the company is financially strong and has performed very well since the year 2020. If we talk about the most recent action of the stock, it might decline to a further lower level. This is because the technical indicators for the stock are giving a sell signal. It is also making strong bearish candles on the charts. This indicates that the ZM stock price can lead to lower levels and hit the support zones.
Technical Levels
- Support levels- $55.00 and $60.00
- Resistance levels- $75.00 and $85.00
Disclaimer
The information provided in this article, including the views and opinions expressed by the author or any individuals mentioned, is intended for informational purposes only. It is important to note that the article does not provide financial or investment advice. Investing or trading in cryptocurrency assets carries inherent risks and can result in financial loss.




