
 Dacity Coin
 Injective
 Starknet
 NEAR Protocol
 Pearl
Pearl Quantus
 Pump.fun
- The stock price of RIOT has declined by over 17% in the last six months.
- The annual profit margin percentage of the company has also declined.
- RIOT’s MACD line has formed a negative crossover, and is accompanied by the presence of a red histogram.
Riot Platforms, Inc. (NASDAQ: RIOT) operates as a company involved in Bitcoin mining and offers specialized cryptocurrency mining computers. Additionally, it has made investments in Verady, Coinsquare, and Tess.
The price trend of RIOT stock is currently pointing in a downward direction, characterized by the formation of a pattern with lower lows.
As of the latest market session, RIOT stock is trading at $8.84, reflecting an 8.58% decline, with an average trading volume of 17.5 million.
In February 2021, RIOT stock achieved its peak at $79.50; however, it went through a substantial downturn, witnessing a significant 94% drop in value over the subsequent year and a half. Despite this decline, the price found support at the $3.3 level and attempted a recovery.
The current price of RIOT stock finds itself within the range of a descending triangle pattern, indicating a bearish trend. A notable resistance level was encountered at $19.49, producing a reversal in the price trajectory. This suggests a potential decline in the future. The overall structure of RIOT stock appears to be negative, with the price forming an unfavorable pattern. Consequently, it is expected that the price will continue to decrease in the days ahead.
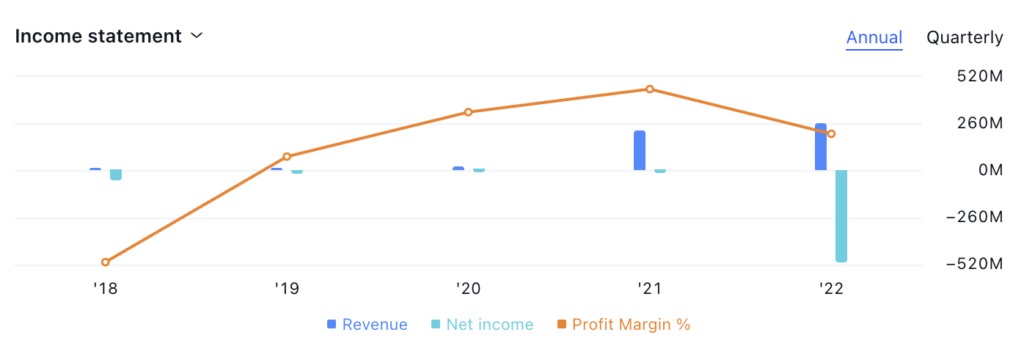
The technical indicators summary reveals that among the top 26 indicators, the majority are signaling a ‘sell’ recommendation. RIOT stock has shown a decline of nearly -17% in the last six months, indicating a poor performance by the company in the previous year. This might create a negative image of the company in the minds of investors.
Riot Platforms, Inc. (RIOT) Stock Price
RIOT by writer50_tcr on TradingView.com
The MACD line consistently remains below the signal line, with the formation of a red histogram, emphasizing the stock’s bearish trend.
Furthermore, the RSI exhibits a bearish indication, with the RSI line situated below the 50 level. This downward positioning, coupled with the RSI’s distance from the SMA line, accentuates the stock‘s unfavorable market outlook.
Conclusion
As per the analysis, RIOT stock has recently undergone a price reversal subsequent to encountering a resistance level. The overarching trend in the stock market remains pessimistic, with a notable decline in earnings. Additionally, the indicators are giving a negative signal for the stock price. Thus, the price is likely to decline in the upcoming days.
Technical Levels
- Support Level – $10.8
- Resistance Level – $25.5
Disclaimer
The views and opinions of the author or anyone named in this article, are for informational purposes only. They do not offer financial, investment, or other advice. Investing or trading crypto assets involves the risk of financial loss.




