
 Injective
 Celestia
 streamoors
 Sui
Sui Pudgy Penguins
 Bitcoin
 Pearl
Pearl
- Luxury meets sustainability: Gaucho Holdings starts the process of turning part of its portfolio into organic cultivation.
- Gaucho Holdings was founded in 1999, or twenty-four years ago. At the time of writing, the cost of VINO shares is $1.06.
The publicly traded Gaucho Group Holdings, Inc. (NASDAQ: VINO) is a quickly expanding e-commerce-focused holding company. It was founded from the bottom up and presently manages a portfolio of real estate and experiential luxury brands.
Fundamental Analysis of Intuitive Surgicals
The market valuation of VINO stock at the current time is $4.28 billion. In 2022, the market cap decreased by 46.55% when it is compared to the year 2021. The amount by which it decreased is approximately around $3.74 billion.
The firm published its year-end report on 31 December 2022. The firm’s net loss for 2022 was reported to be $21.75 million. In 2022, the business made a gross loss of $84.19 K.
The company registered a total revenue of $1.64 million in 2022. Its operating loss in 2022 was $8.78 million. These fundamentals were not fruitful except for total revenue.
Technical Analysis of VINO Stock
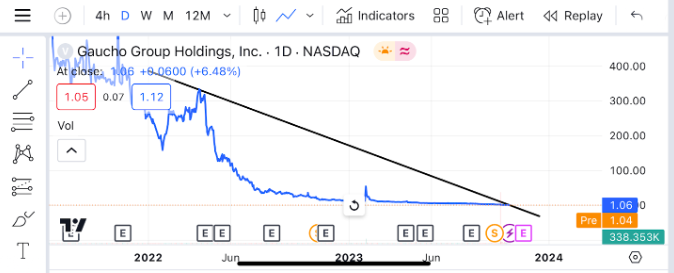
The VINO stock is not doing well in the single-day trading time frame. It was up by $1.06 which means it rose by 6.48% on 21 October 2023, which is quite good. As we can see, the stock near the press time is taking resistance from the downtrend line. It implies that the VINO stock might continue to go down in the next trading days.
As in the daily time frame, the VINO stock has been making red candles which indicates that the stock has been making corrections. The stock in the 1-Month is down by 63.56%. Over the history of VINO stock is down by 98.99%. Year to date it is down by 90.86%.
On October 20, 2016, within the 1-D time frame, the price of the Vino stock peaked at roughly $5,397. The Vino stock started to move in a downward direction, as can be seen. It has been going in the same downward manner since 2021. It kept moving lower since it was unable to break through the downtrend line.
Technical Indicator
The RSI line is below the 50 level which means the VINO stock losses are more than the gains in the price. The 100 Days- SMA indicates sell-off at a $4.14 market price. Its SMA- 200 Days shows selling action at $7.66.
The EMA-100 days imply selling action at the $4.49 price level. It’s 200 days- EMA implies a sell-off at the $17.16 price level.
Live Chart of VINO
Conclusion
The VINO stock price may rise by 27.84% in a few weeks. It implies that prices might approach the $1.342358 mark. As per the forecast done by experts, the stock might rise.
Technical Levels
- Support level- $0.8633 and $0.9617
- Resistance level- $1.1492and $1.2383
Disclaimer
The views and opinions stated by the author, or any people named in this article, are for informational purposes only and do not establish financial, investment, or other advice. Investing in or trading crypto or stock comes with a risk of financial loss.



