
 Dacity Coin
 Celestia
 Bitcoin
 Pearl
Pearl Quantus
 Injective
 Hyperliquid
- The A2Z stock price has surged by over 19% in the previous trading session.
- It has melted down by over 85% from the all-time high level.
- The AZ stock price has formed a symmetrical triangle pattern on the daily chart.
The A2Z stock price surged by over 19% on 24 October 2023. This firm has announced that it was successful in the pilot phase at Carrefour, which is one of the world’s leading retail chains. It has received positive feedback and achieved great customer satisfaction. After the successful pilot run the company is looking forward to a Rollout Phase soon.
The A2Z stock price has been in a downtrend since January 2022 and melted down over 82% of the gains till now. However, this fall was halted in November 2022 and the price has been trading positively sideways since then. It has delivered a good performance for the swing traders as the stock has given a good move on both sides. The stock price has given an upward move of over 236% from the lower level and is trading at about 89% above the lows.
The AZ stock price’s behavior this year is very volatile as the stock has been given an equal amount of opportunity to both buyers and sellers. At the beginning of the year, the stock declined and started recovering in April. This upward was lasted till June 2023, after that it started to fall in June itself and is currently following the same downtrend and trading at a discount of over 42% from highs.
An Overview of the AZ Stock Chart
The AZ share price has been trading inside a symmetrical triangle pattern and has recently taken good support from the lower trendline of the same. It seems like the price has tested the lower trendline twice and formed a double-bottom pattern, which is considered bullish. The stock price has created a long lower wick doji candle followed by a giant bullish candle which suggests bullishness.
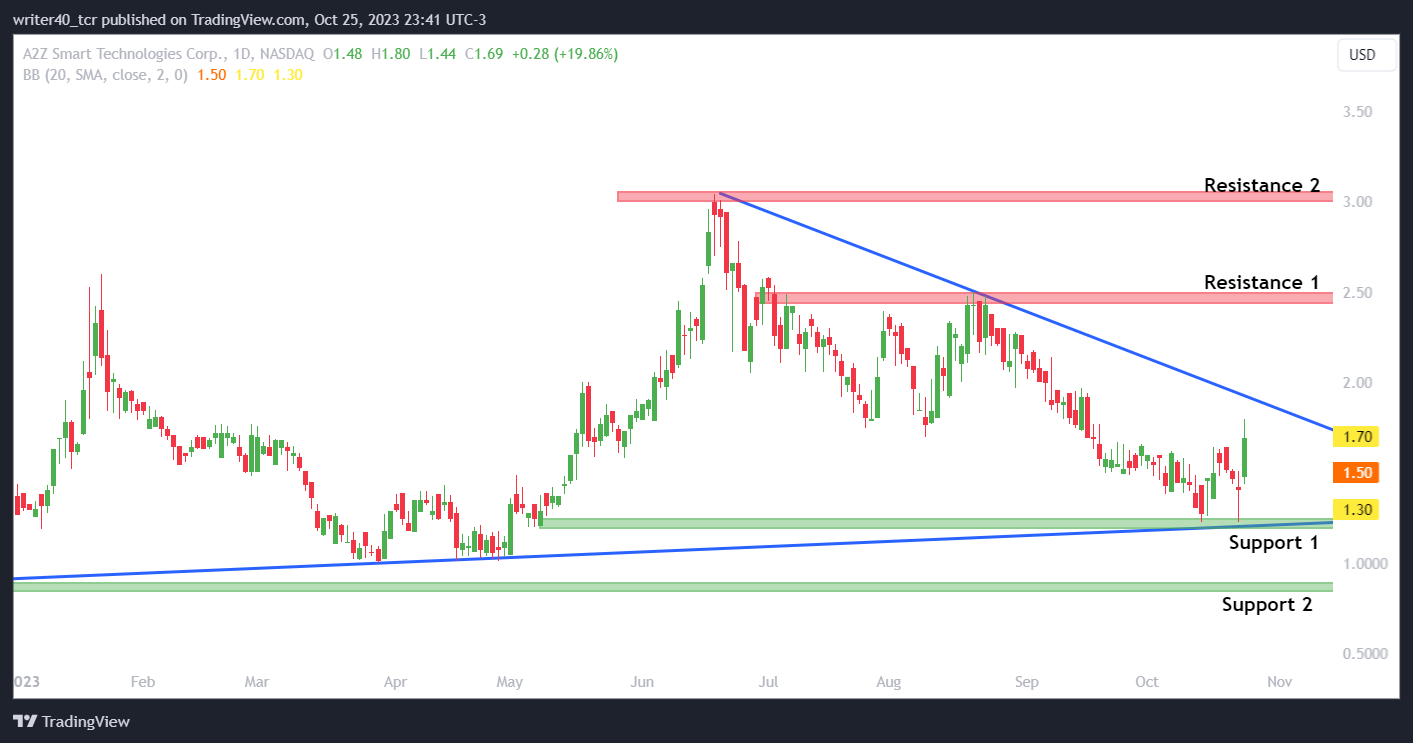
The stock price is trading very close to the swing lows that were created in July and August 2023. It can face some resistance near the level of $2.44 and $3.04 as it has been seen that some sellers are actively present there. Considering the support level it is present at the level of $1.19 and $0.8714 which can provide some push towards the upside.
An Outlook of Bollinger Bands and Relative Strength Index
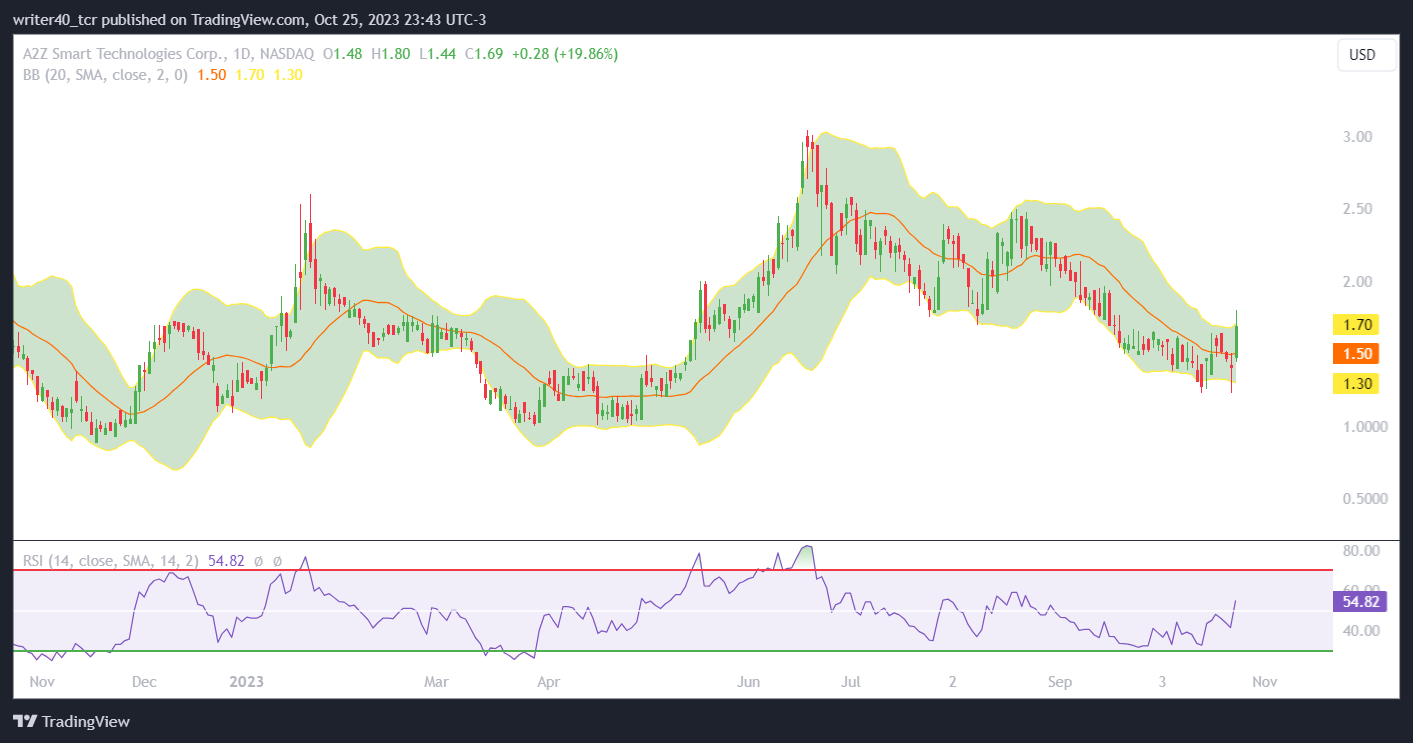
The price has recently closed near the upper band of the indicator and it can take some resistance near the price. If we observe the band, it is currently narrow which indicates that the price is still less volatile even after it surged for about 20%. The relative strength index is currently moving towards the strong bullish momentum and it shows that the price can show some good upside ahead.
Conclusion
The A2Z stock price after a recent development is looking favourable for the bulls in the coming times. It has surged well and holding the levels signifies that some strong long position has been created. The relative strength index is favoring the bulls now, which is also a positive sign for the stock. However, the price is close to the Upper band of the Bollinger Band which can provide some liquidity to the price.
Technical level
Resistance – $2.44 and $3.04
Support – $1.19 and $0.8714
Disclaimer
The views and opinions of the author, or anyone named in this article, are for informational purposes only. They do not offer financial, investment, or other advice. Investing or trading crypto assets involves the risk of financial loss.




