
 Minter
 Quack AI
 NEAR Protocol
 Sui
Sui Hyperliquid
 Cardano
 Raydium
- Crane company price has jumped by over 13% after the Q3 result beats the estimate.
- Deutsche Bank has initiated a buy rating on the Crane Company stock.
- Crane company is trading close to the crucial resistance level of $95.
Crane company has surged by over 13% in the last trading session. This jump happened after the company posted a Q3 result and it beat the market estimate. It has reported an earning for the Q3 of $1.03 per share and the market was expecting it to be in the range of $0.87. The stock price has reacted positively to this news and formed a bullish candle on the daily chart.
Crane Company was listed in April 2023 and is currently in a sideways to positive trend. It has been trading horizontally since July 2023. The upper level from where the stock has been facing resistance, is near the level of $95. Considering the lower level, the price has taken support near the level of $82.55.
Crane Company has been rated by Deutsche Bank, it has initiated a buy rating on the stock. The target price set by the bank is $118. It is still far away from the current market price of the stock and can help to boost the price of the stock in the future. The recent behavior of the price is looking positive and it seems like the stock can achieve the target price sooner.
An outlook of the Crane Company stock chart
The CR stock broke the trendline on the downside in September 2023. However, the stock price was not able to show some significant downside as the stock is in uptrend. It means the buyers are present at each level and are restricting the price to go down. The last session move has increased the confidence of the buyers and it will help them to breach the resistance level of $95.
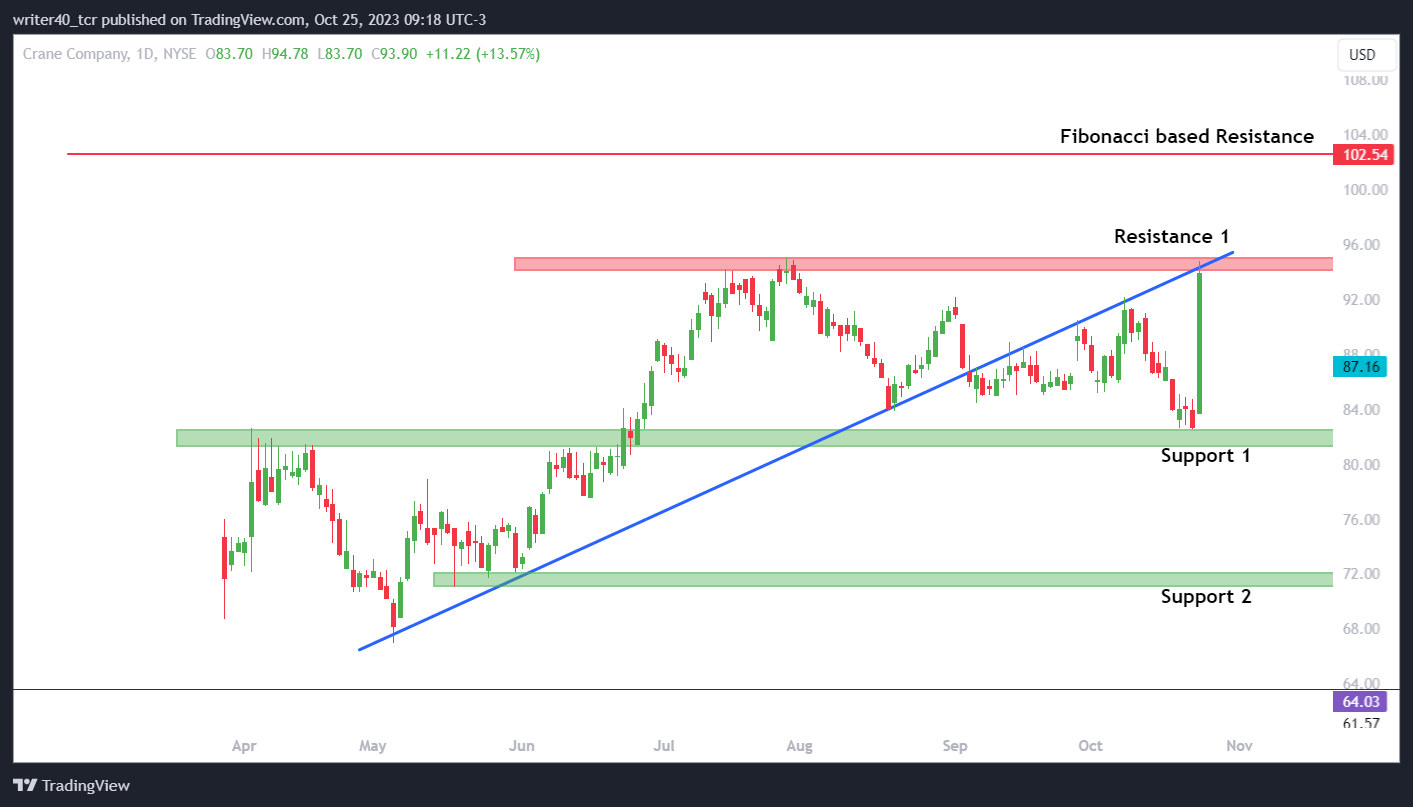
Considering the resistance level of the stock, the first and last resistance for the price is present near the level of $95. Apart from this, the trendline is also providing some liquidity to the price and has restricted the price to go further up. The support level is present at the level of $82.55. Apart from this, other support is present at the level of $72.10, marked as support 2 on the chart.
An Overview of the Bollinger Band And Relative Strength Index
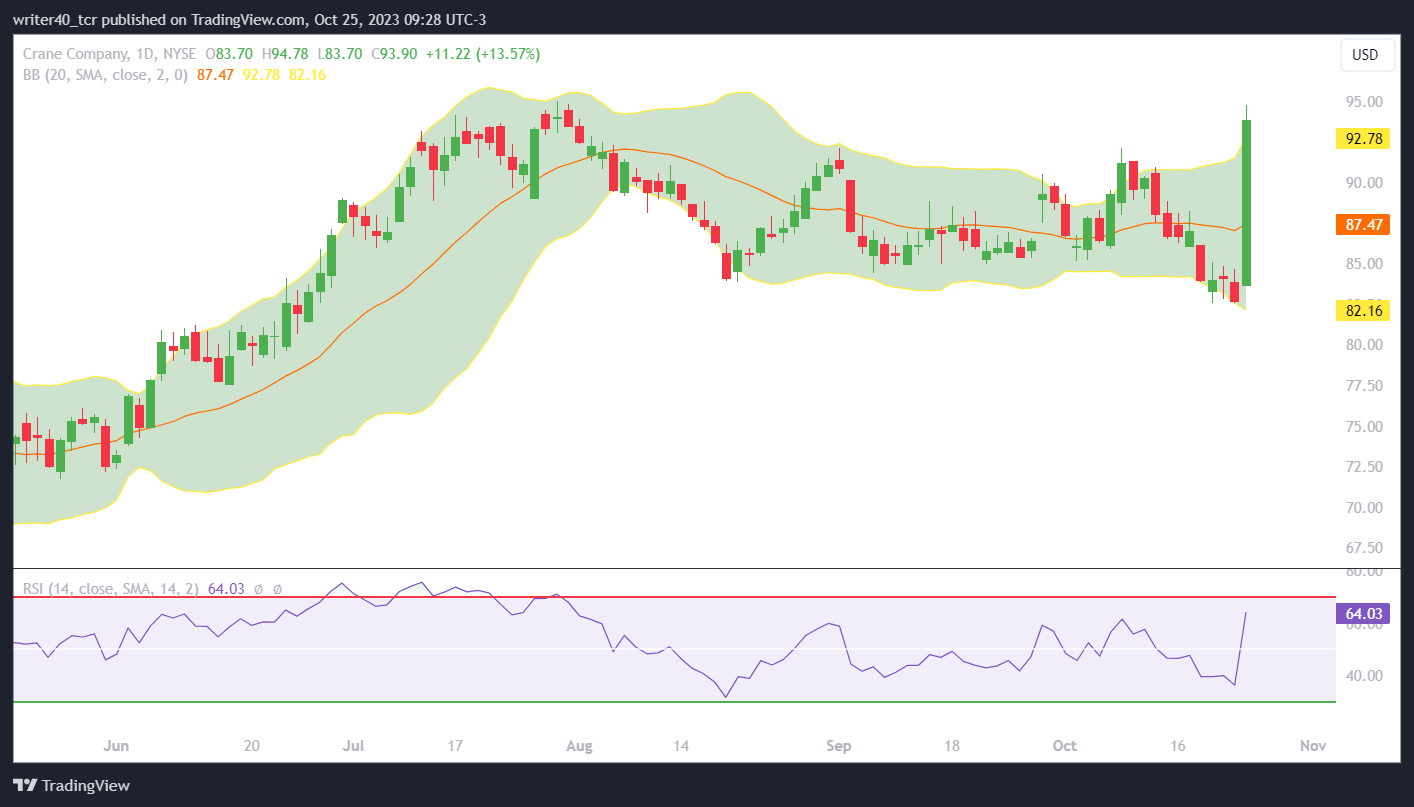
If we observe the Bollinger Band, it has been flat since July. The last-day candle has shown a giant strength in the favour of bulls. The stock price has been able to close above the upper band of the Bollinger Band and is looking strong. Considering the Relative Strength Index it is currently placed at 64.03 which is a bullish sign for the stock.
Conclusion
The CR stock price is looking strong near the resistance level and the company has reported a positive financial growth in Q3. Several rating firms have initiated a buy rating on the stock which can also boost the price. If the stock breaches the resistance level of $95, it can move towards the level of $102.54. It is a Fibonacci-based resistance level. $82.55 and $72.10 will act as support.
Technical Level
Resistance – $95 and $102.54
Support – $82.55 and $72.10
Disclaimer
The views and opinions stated by the author, or any people named in this article, are for informational purposes only. They do not establish financial, investment, or other advice. Investing in or trading crypto assets comes with a risk of financial loss.




