
 streamoors
 Celestia
 Injective
 Pudgy Penguins
 NEAR Protocol
 Pearl
Pearl Starknet
- The NCLH stock does not pay dividends to its shareholders.
- Norwegian Cruise Line Holdings Ltd. has given a return of -6.69% in the previous year.
- This firm’s ROA decreased by -78% YoY.
Norwegian Cruise Line Holdings Ltd. offers cruise travel services, delivering diverse cruise experiences to travellers with worldwide itineraries.
Norwegian Cruise Line Holdings Ltd. (NCLH) stock is presently in a descending trend, characterized by a series of lower lows in its price trajectory.
The NCLH stock is currently trading at $13.95 with a decline of -0.75% in the pre-open market session. The company has a beta of 1.98, which is slightly high. A beta of more than 1 is considered highly volatile and it is risky.
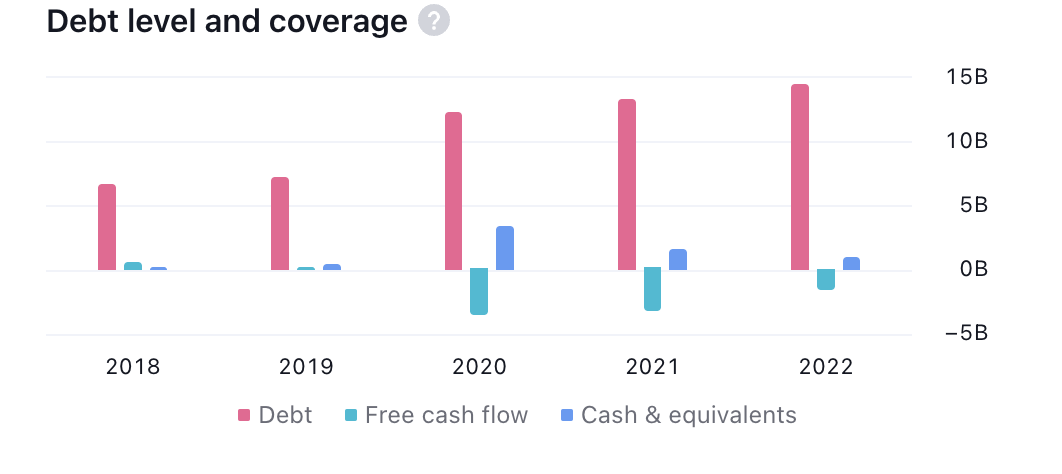
The company has a debt of $14 Billion and free cash flow is in negative figures. It is a poor sign for the company and it represents that the company have weak financial management.
The absence of dividend payouts to its shareholders may discourage investors who rely on passive income.
The technical indicator summary is signalling a strong sell for NCLH stock, with 16 of the 26 indicators suggesting a bearish stance. Meanwhile, 4 of the indicators suggest a buy. Moreover, the moving averages summary is in favour of strong selling, with 13 out of 15 moving averages endorsing a sell signal. These combined signals indicate a prevalent negative momentum in the stock’s performance.
This company has recently shown a breakdown of the triangle triangle pattern. The price is heading downward and it is expected to fall further as the overall sentiments are favouring a negative momentum.
Norwegian Cruise Line Holdings Ltd. (NCLH) Technical Analysis
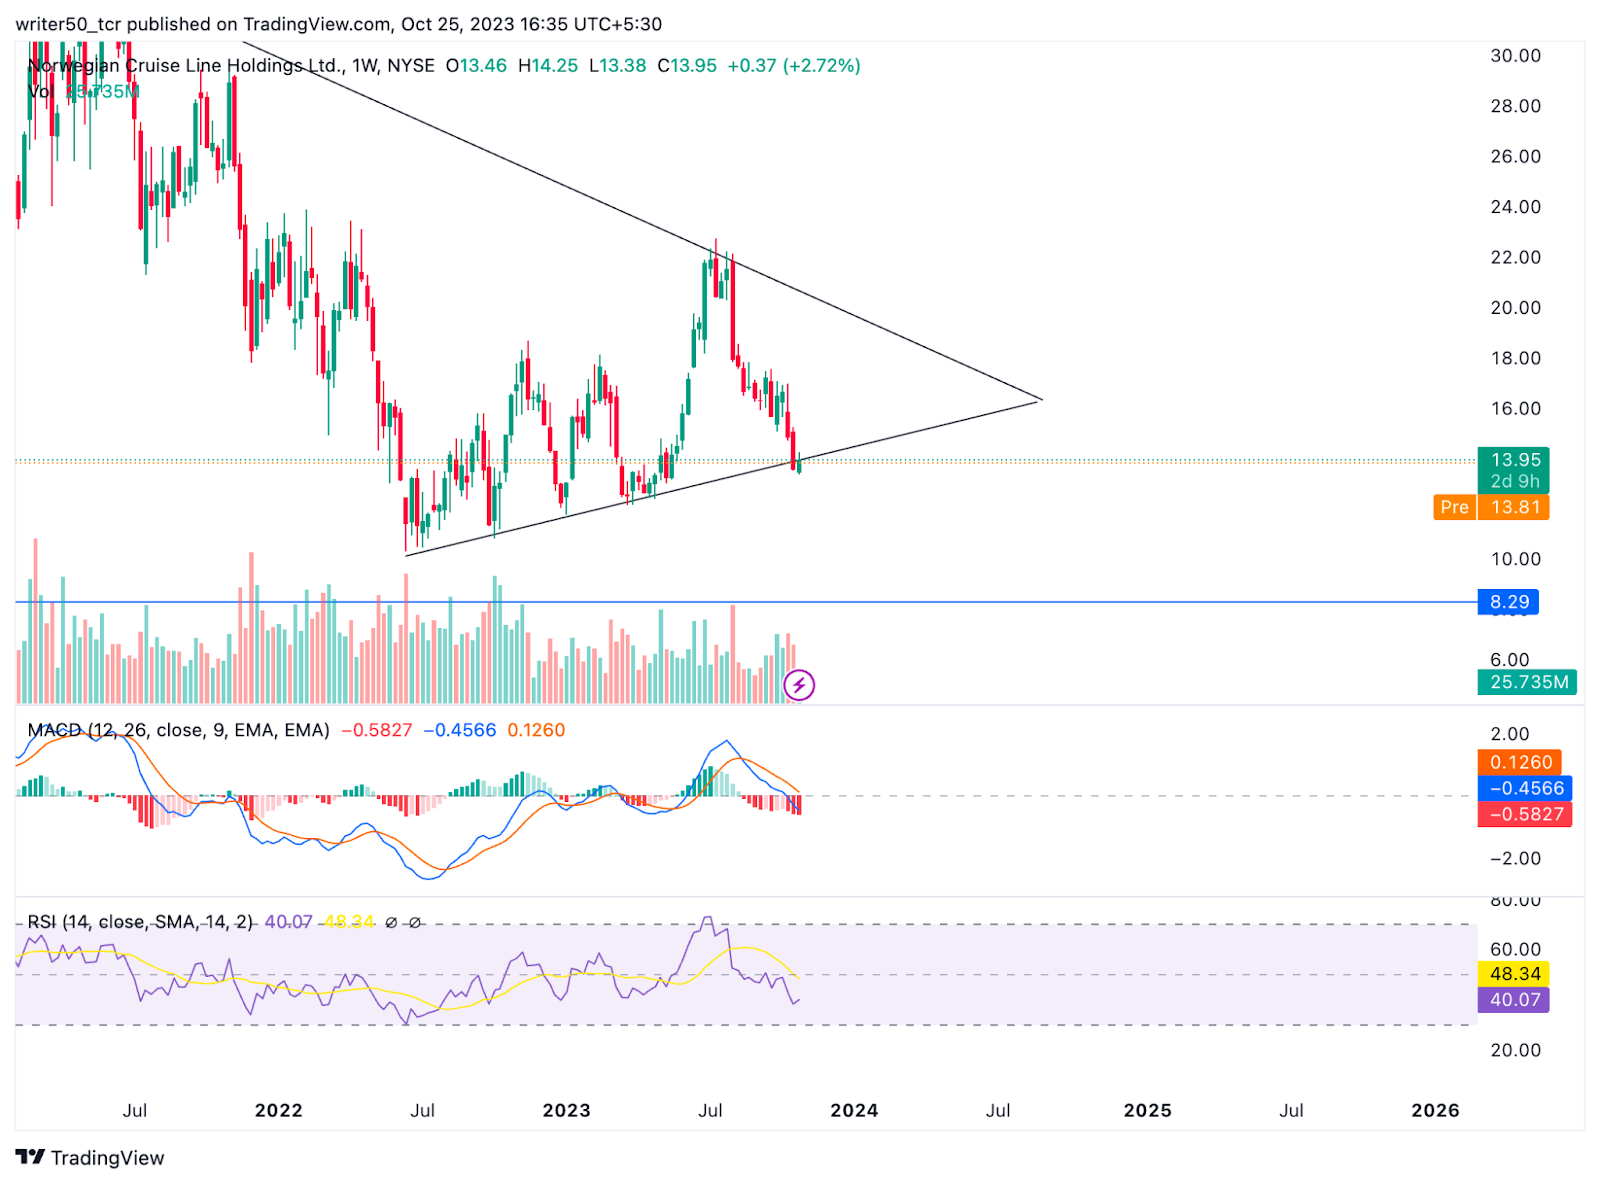
The MACD indicator for NCLH stock is currently showing a bearish signal, as the MACD line is below the signal line, accompanied by a red histogram. These indicators collectively point to a potential decrease in the stock’s price.
Additionally, both the RSI line and the SMA line are positioned below the 40 level, indicating a negative sentiment. This RSI setup further suggests the possibility of impending price declines for NCLH stock.
Conclusion
In summary, the NCLH stock is currently following a downtrend momentum. The price has shown a negative return in the previous year along with the negative ROA. the indicators are negative for the stock and the price is likely to decline in the upcoming days.
Technical Levels
- Support Level: $12.37
- Resistance Level: $19.34
Disclaimer
The views and opinions of the author, or anyone named in this article, are for informational purposes only. They do not offer financial, investment, or other advice. Investing or trading crypto assets involves the risk of financial loss.



