
 Covenant x402
 hi
hi Pearl
Pearl Quantus
 Pudgy Penguins
 Boomer
 Lighter
- The STLA stock price has slipped out from an ascending channel.
- It faced resistance from the 50-day EMA, indicating a short-term fall.
Stellantis NV (NYSE: STLA) is an automotive company headquartered in the Netherlands. It designs and manufactures the vehicle components and sells production systems through the distributors. The company offers retail and finance dealing, leasing, and rental services through third-party financial institutions, joint ventures, and subsidiaries.
Comparing the Company’s Financials and Stock Performance
The firm has been performing competitively for the last three years. It has generated a total annual revenue of $179.59 Billion which increased by 20.19% compared to the year 2021. Meanwhile, the STLA stock has lost over 24% of its value.
According to the 2023 quarterly statement, the company has experienced some positive profitability. It holds more asset value increased by 8.97% compared to the previous year. Consequently, the stock price also gave a bullish rejection of up to 15%.
In the current month, the STLA stock price has given a bearish rejection from the $20.05 resistance level. As a result, it is moving towards the immediate support level of $18.04 with a volume of 31.789 Million.
The STLA price is trading within the yearly range of $20.71 to $12.79 while holding a yearly target of $23.19. It has a current market capitalization of $57,890,729,744 with an average volume of 7.54 Million.
Technical Analysis of the STLA Stock
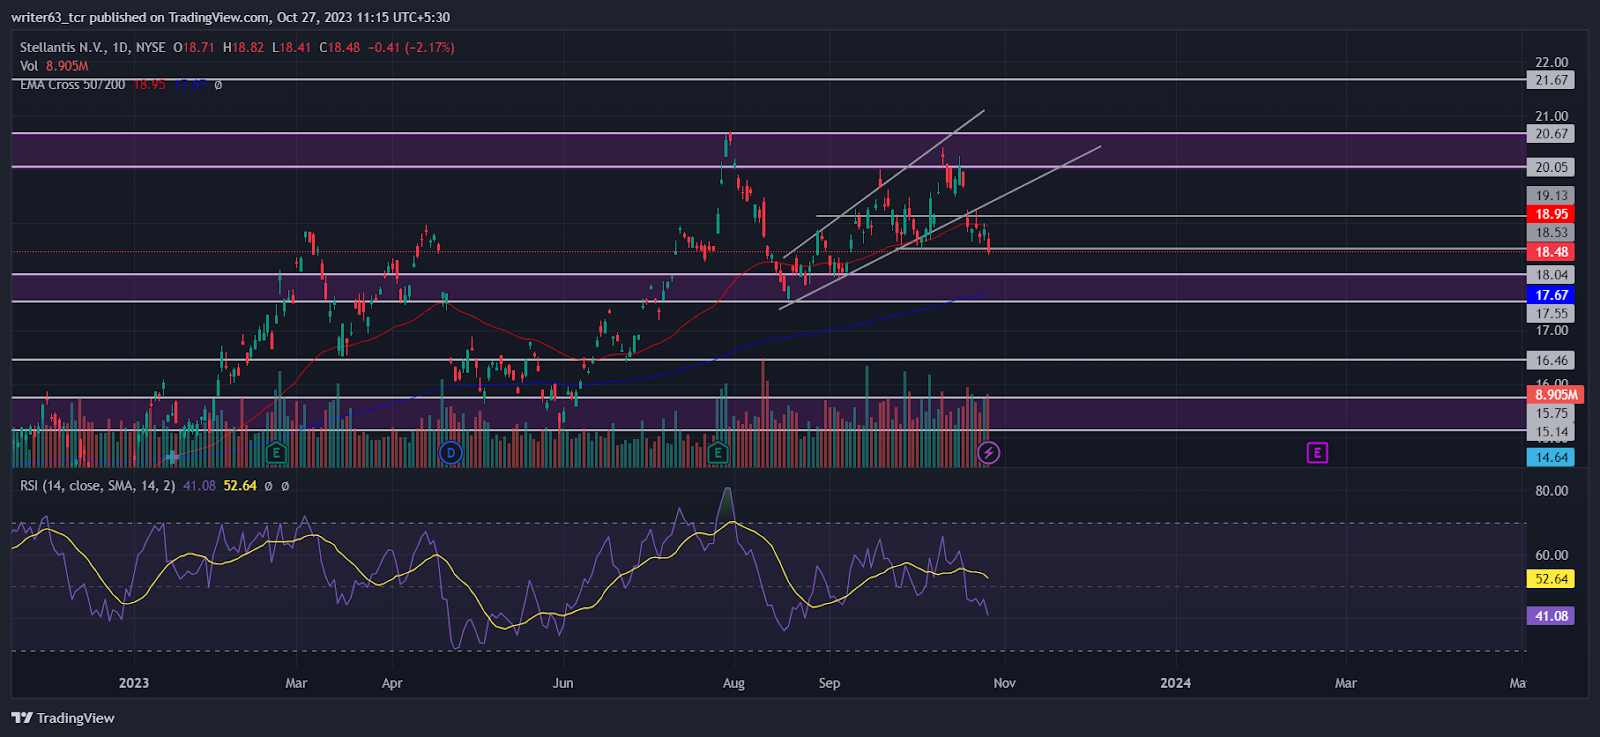
STLA stock’s price is currently performing between the 50-day and the 200-day EMAs, indicating a short-term fall. It recently faced resistance from the 50-day EMA or the breakdown level of $19.13, which boosted the short-term scenario.
After STLA stock’s price made a swing high at the $20.67 level, it retested the $17.55 pivotal level. From there, it is moved within an ascending channel and gave a breakdown at the $19.13 level. In the last trading session, it formed a bearish rejection candle, expressing the sentiments of the sellers. At press time, the price is moving towards the lower end of the channel at $17.55.
Furthermore, the relative strength index (RSI) is sloping similar to the price chart displaying bearish momentum. At present, the RSI is at 41.08, below the signal line moving toward the lower band.
Conclusion
Since the bullish crossover between the 50-day EMA and the 200-day EMA, the STLA stock price has been in an uptrend. It failed to create a new swing high and gave a breakdown of the ascending channel at $19.13. The STLA stock price is moving towards the lower end of the ascending channel at $17.55. If the price manages to close below the $17.55 level, it may be seen falling to the $16.46 support level. However, for the yearly target of $23.19, it should close above the 20.67 resistance.
Technical Levels
- Resistance levels: $20.67 and $21.67
- Support levels: $17.55 and $16.46
Disclaimer
The views and opinions stated by the author, or any person named in this article, are for informational purposes only. They do not establish financial, investment, or any other advice. Investing in or trading stocks comes with the risk of financial loss.




