
 Minter
 Quack AI
 NEAR Protocol
 Pearl
Pearl Sui
Sui Pons
Pons Quantus
- Price has formed a head and shoulders at the $27.36 level.
- Sellers dominated the 50-day EMA by a strong bearish candle.
Oceaneering International Inc. (NYSE: OII) is a global technology company that provides engineered services and products. Primarily, it serves as an offshore oil and gas industry, with a focus on subsea applications. The company also uses its applied technology ability to serve the entertainment, material, aerospace, science, defense, and renewable energy industries.
Financials and Some Recent Actions of the OII Stock
OII stock price has started its bullish rally since September 2022. After two months, it started a very strong uptrend by the bullish crossover between the 50-day EMA and the 200-day EMA. However, during the last quarter of 2022, the company experienced some low profitability compared to the third quarter.
Subsequently, the stock price jumped over 50% in the last month of the second quarter. Meanwhile, the firm also reported positive increments in revenue and net income of $597.91 Million and $19.00 Million.
After the third quarter, the company released its report, in which it performed competitively as per the year-to-year change. Its revenue increased by 13.49% along with 43.43% profitability in net profit margins.
The one-year target price of the OII stock stands at $22.50. It is currently trading between the 52-week low and high of $27.46 and $12.12. It annualized its dividend at $0.60 while the current yield is at 2.59%.
Technical Analysis of the OII Stock Price
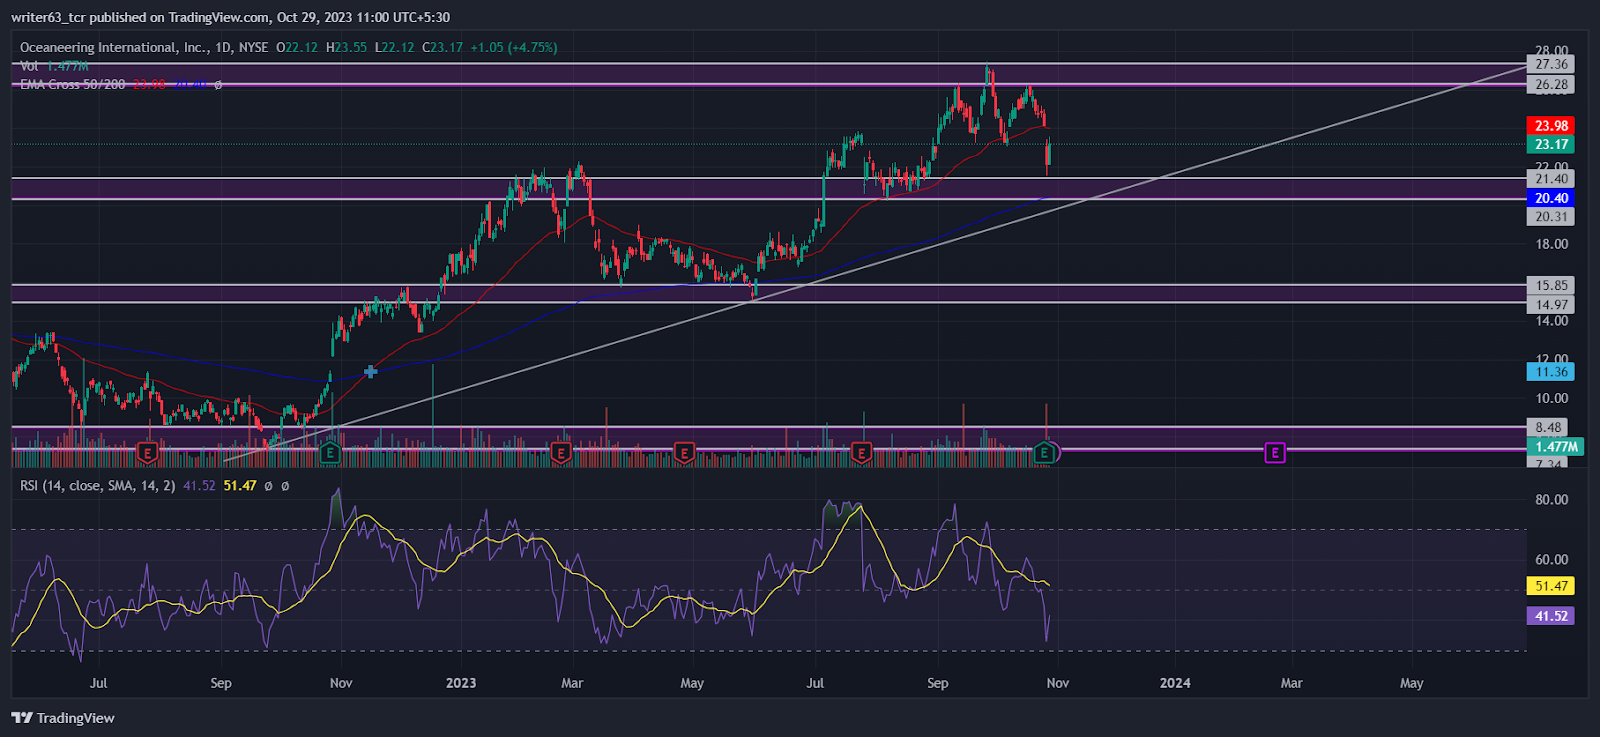
The OII stock price is currently performing below the 50-day EMA and above the 200-day EMA, reflecting a short-term fall. If the sellers manage to cross below the 200-day EMA, it would be a shift in the price trend.
At press time, the price has given a breakdown from the head and shoulders formed at $27.36. Subsequently, it made a bullish candle at the immediate support level of $21.40, which holds a possible requirement for the bullish reversal. However, the price is moving toward the trendline forming below. If it closes below the $20.31 support level, it may drop to the $15.85 support.
On the other side, the relative strength index (RSI) is sloping at 41.52 toward the 30-mark lower-band. It showed a bearish divergence from the middle part of the head and shoulders price pattern.
Conclusion
OII stock price has been performing in an uptrend since September 2022. It has given a breakdown of the head and shoulders price pattern. In the last trading session, it formed a bullish candle at $21.40 indicating a sign of a potential reversal. However, the price is moving toward the trendline forming below. Suppose it closes below the $20.31 support level, it may drop to the $15.85 support. Otherwise, the stock price may rise to the $26.28 resistance after pulling back from the trendline.
Technical Levels
- Resistance levels: $26.28 and $27.36
- Support levels: $20.31 and $14.97
Disclaimer
The views and opinions stated by the author, or any person named in this article, are for informational purposes only. They do not establish financial, investment, or any other advice. Investing in or trading stocks comes with the risk of financial loss.




