
 Dacity Coin
 astronaut
 Celestia
 Injective
 Bittensor
 Quantus
 Pearl
Pearl
- PM stock has given a return of -0.6% in the previous year.
- PM stock has received a ‘sell’ signal by the technical indicators summary.
- The profit margin percentage of the company has declined.
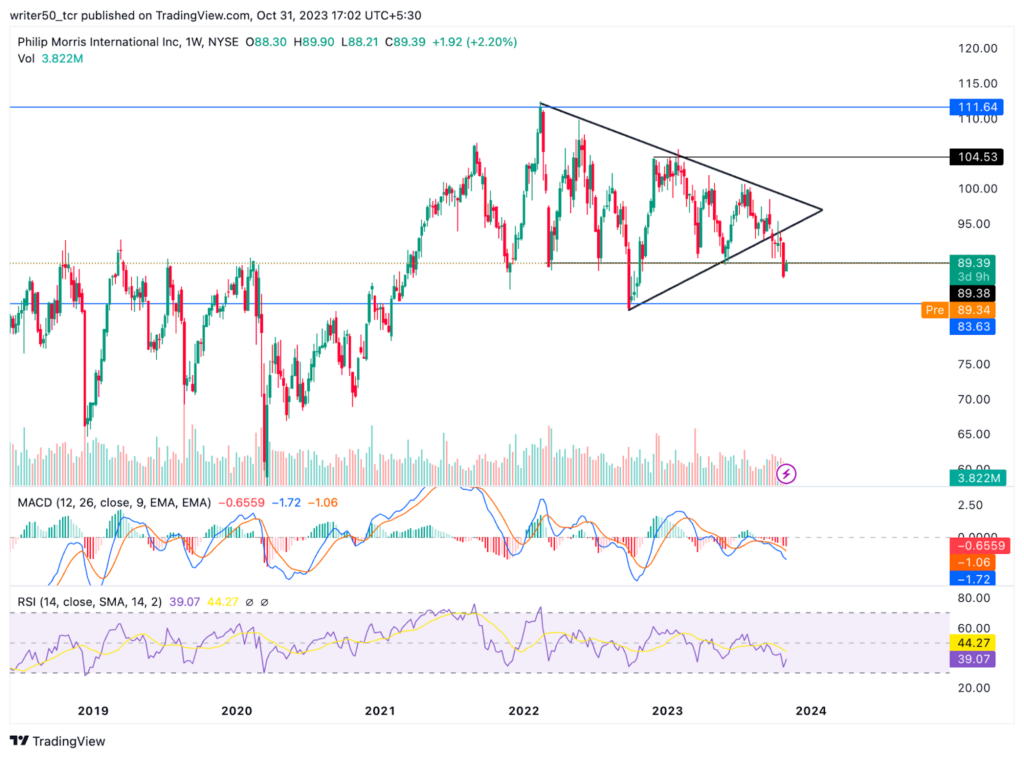
The current price trajectory of Philip Morris International Inc.(NYSE: PM) stock clearly exhibits a downtrend, characterized by a consistent pattern of setting lower lows.
The technical indicator summary for PM stock is indicating a ‘sell’ recommendation. Among the 26 indicators analyzed, the majority provide ‘sell’ signals, with only a few suggesting a ‘buy’ signal. This indicates a prevailing bearish sentiment in the stock. In June 2017, PM stock reached its peak at $123.55. Subsequently, it underwent a substantial decline over the following two years, experiencing a drop of nearly 57%. However, it eventually found robust support at the $57 level, marking a turning point and subsequently undergoing a remarkable recovery, with gains exceeding 90%. Despite this recent upward movement, the price again started falling. The price movement has formed a triangle pattern. A breakout from a symmetrical triangle pattern would indicate a shift in sentiment.
In the previous year, PM stock has given a negative return of -0.6%. This underperformance may discourage potential buyers as it raises concerns about the stock’s current trend and attractiveness as an investment. Additionally, the company’s profit margin percentage has declined over the previous year, further impacting investor interest in establishing new positions.
Which Way Will the PM Price Move?
Technical Indicators Summary
Upon closer examination of the weekly MACD line , it is worth noting that it currently maintains a position below the signal line, which is indicative of a bearish trend. The presence of a negative crossover further enhances the likelihood of a continued decline in the PM stock price in the near future.
The RSI line is positioned below the signal line, depicting a bearish pattern that suggests a potential price decrease in the days to come. Furthermore, a more detailed analysis of the charts reveals a gradual decline in the trading volume of PM stock. This diminishing volume serves as a concerning signal, aligning with the existing downtrend in the stock price and indicating reduced market activity.
Conclusion
In conclusion, PM stock is moving in a downward direction. The price has formed a triangle pattern and the overall structure of the stock is negative. The price indicators are also negative for the stock. Hence, the price is likely to decline in the upcoming days.
Technical Levels
- Support Level – $86 and $83
- Resistance Level – $90 and $95
Disclaimer
The views and opinions of the author, or anyone named in this article, are for informational purposes only. They do not offer financial, investment, or other advice. Investing or trading crypto assets involves the risk of financial loss.



