
 Quack AI
 Pearl
Pearl Solana
 NEAR Protocol
 Canton
 XRP
XRP Derive
- The JKS stock price has observed an increase of 10.32% during the intraday trading session.
- The price poved more than 30% in the last three trading sessions.
Founded in 2006 in China, Jinko Solar Holding Company Limited (NYSE: JKS) is a solar panel manufacturer company. It started its work as a wafer manufacturer and after that, the company was involved in the manufacturing of solar modules. It sells its solutions and services and distributes its solar products to various international utilities, and residential, and commercial customers.
An Overview of the JKS Stock’s Recent Financials
The company performed competitively well in the last year. It reported its 2022 annual revenue of $12.34 Billion, which is twice as large as the revenue of 2021. On the other side, the JKS stock price experienced a decline of 11.05% within the overall range of 54% in the year 2022. At present, JKS stock gave a -22.85 negative return during a year’s timeframe. The revenue estimation for this year will be $16.04 Billion. According to the quarterly reports, the earnings per share has been doing well for the last four quarters.
The company’s EPS for the last quarter was $3.32, whereas the estimation was around $1.44, which reflects an increase of 130.44%. Furthermore, the fourth quarter revenue is estimated to be around $4.18 Billion. Meanwhile, the stock price has experienced a decline of 31.57%. The yearly target for JKS stock is $52.48 while moving between a yearly range of $61.27 to $25.15. The current market capitalization of the company is $1.681 Billion with 51.326 Million float shares outstanding.
Technical Analysis of JKS Stock
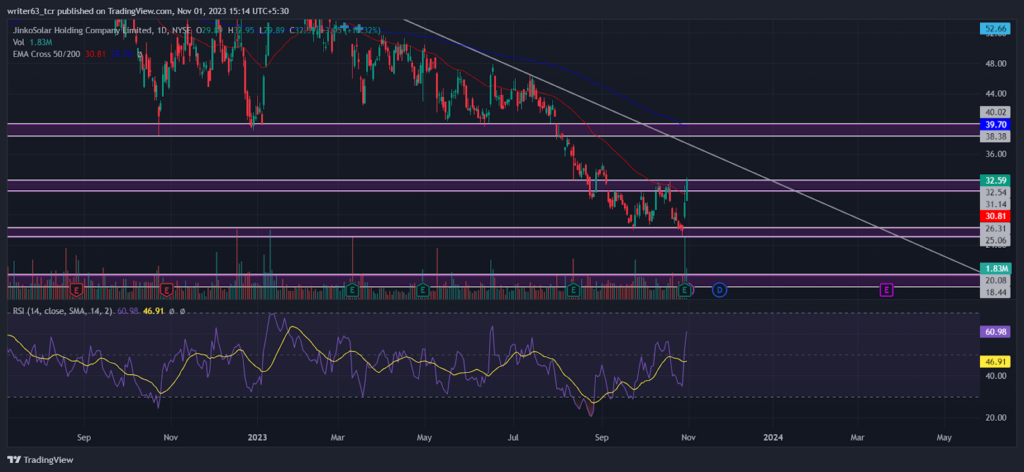
The JKS stock price closed above the 50-day EMA after facing resistance from it. Currently, the price is moving between the 200-day and the 50-day EMAs, reflecting a short-term bearish pullback.
As of the latest update, the JKS stock price stands at $32.59 and appears to be approaching an upward trendline that is forming. Following the breakout from the descending triangle pattern, the stock found support around the $26.31 level. Presently, the price is heading towards the $38.38 level, which serves as the current resistance.
However, if the JKS stock price encounters resistance from the trendline, there is a possibility that it may decline to the $25.06 support level. Based on the Relative Strength Index (RSI), the price is exhibiting a bullish divergence, which suggests positive signals. The RSI is currently trending at 60.98 and is moving toward the upper band around the 70-mark. This indicates potential upward momentum in the stock’s price.
Conclusion
The JKS stock price is moving in a downtrend. It gave a breakdown of the descending triangle pattern which led the price further down to the $25.06 support level. At press time, it is moving to retest the breakdown level of $38.38. If the JKS stock price faces resistance from the trendline, it may fall back to the $255.06 support level. However, to gain bullish momentum, it should close above $48.13.
Technical Levels
- Resistance levels: $32.54 and $40.02
- Support levels: $25.06 and $18.44
Disclaimer
The views and opinions stated by the author, or any person named in this article, are for informational purposes only. They do not establish financial, investment, or any other advice. Investing in or trading stocks comes with the risk of financial loss.




