
 Dacity Coin
 Celestia
 Pudgy Penguins
 Injective
 Solana
 Sui
Sui Starknet
- The TM stock price is currently at $175.18 with a volume of 334.476K.
- The price is moving above the 50-day exponential moving average.
Toyota Motor Corporation (NYSE: TM) is a manufacturer of passenger vehicles, minivans, and commercial vehicles. It claims to be one of the largest vehicle manufacturers in the world. The company also provides finance for the purchase or lease of Toyota vehicles and conducts its automotive sales and services all around the world.
Company’s Financials and the Stock Details
Toyota has been performing competitively well for the last three years. It reported its 2022 annual revenue to be $276.39 Billion whereas the estimation was $274.60 Billion. That accounts for a surprise of 0.65%. Meanwhile, the TM stock price decreased by 26.29% annually. The revenue estimation for the second quarter of 2023 was $72.31 Billion. However, the company generated a revenue of $75.50 Billion, which reflected a surprise of 4.42%. This resulted in a positive surge of 11.82% in the TM stock price.
The estimated earnings for the fourth quarter are $3.00 and it remains to be seen whether the company will achieve this target. In the current month, the TM stock price has stalled in the vicinity of the prior resistance level at $195.84. This situation raises the likelihood of potential quarterly declines in the stock’s value. TM forwarded the last dividend per share of $2.23, while the current dividend yield is at 2.21%. The six-month stock return of the company is 29.57%. However, it dropped nearly 3% in the current month.
Technical Analysis of TM Stock
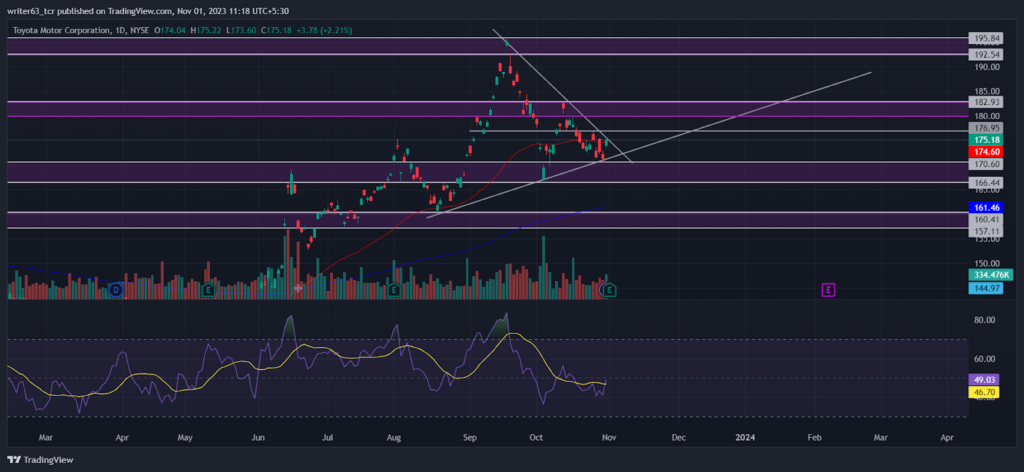
The TM stock price is moving above the 50-day EMA, reflecting a strong uptrend. In the wider timeframe, the 200-day EMA is moving below the current stock price at $161.46, reflecting a long-term bullish trend. The 50-day EMA is currently moving at $174.60.
The TM stock price formed a symmetrical triangle in which the price is trading at $175.18. It took multiple supports from the lower trendline. At press time, the price took support from $170.60 and is moving toward the immediate resistance of $182.93. In the last session, it formed a bullish candle at $173.63 with a volume of 334.476K, showing the buyers’ interest at that level.
Furthermore, the relative strength index (RSI) made a bullish crossover with the signal line, indicating that the bulls are taking control of the price in the current session. The RSI slope is at 49.03, moving toward the 50-mark.
Conclusion
The TM stock price is moving in a bullish trend and it formed a symmetrical triangle pattern. The price is above the 50-day and 200-day EMAs, indicating a strong uptrend. At present, the price took support from $170.60 and is moving toward the immediate resistance of $182.93. If the TM stock price strikes above the $176.95 level, it may reach the $182.93 resistance level.
Technical Levels
- Resistance levels: $182.93 and $195.84
- Support levels: $166.44 and $157.11
Disclaimer
The views and opinions stated by the author, or any person named in this article, are for informational purposes only. They do not establish financial, investment, or any other advice. Investing in or trading stocks comes with the risk of financial loss.




