
 Pearl
Pearl Bitcoin
 NEAR Protocol
 Starknet
 Solana
 Quant
Quant Ondo
Ondo
- The AVA stock price is currently trading at $35.04.
- The company’s share price has gained 12.38% from its recent swing low.
- It has recently given the breakout of the $33.15 resistance level.
Avista Corp. (AVA) is an American electric and natural gas utility company. The firm deals in generating and transmitting electricity and natural gas to commercial, residential, and industrial consumers. It is a small-cap corporation with a market capitalization of 2.711 Billion USD. The company was established in 1889 and its headquarters is in Spokane, WA.
Avista Corp (AVA) Stock Analysis
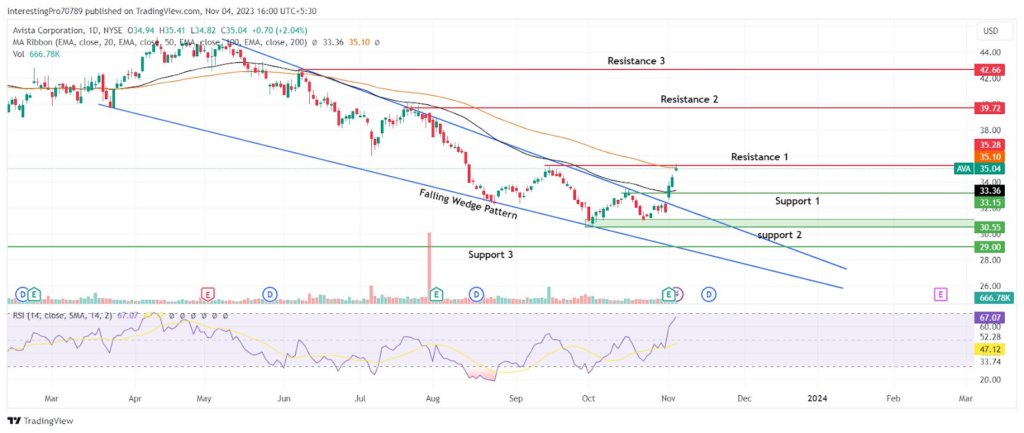
The AVA stock has been in a continuous downtrend since it retested its 2023 annual high of $45.29. The company’s share price has declined by 31.70% since then. The fall in price halted at the $30.55 support zone.
AVA stock’s price has shown significant growth and recovery of 14.76% from its $30.55 support zone.
The AVA increase in price was supported by the increase in buying volume. It denotes the big investors infused their capital at a lower price, which helped the stock price to increase.
The AVA stock has recently given a breakout of $33.15 resistance level, which was also supported by the high buying volume. It shows again the big investors have invested their money and expect a good performance in the upcoming months.
The AVA stock is currently trading at $35.04. It experienced a gain of 2.04% in the last intraday session and traded with a volume of 666.78K.
What’s Next For AVA Stock?
The AVA stock has recently reclaimed the 50-day EMA and commenced a bull run towards the 100-day EMA. The ongoing bull got interrupted at 100-day EMA as there was a strong resistance of $35.28 level.
The relative strength index is at 67.07, which is very near to its overbought territory. It shows the price might face a drop-down in its value as there is no space left in the upward direction for the continuation of the buying pressure.
The AVA price may face a minor pullback to retest the 50-day EMA or $33.15 level again. The price has been in a downtrend for a very long time. So, it may be difficult for the price to give the $35.28 resistance level to do a V-shape recovery. The chance for consolidation in the range of $35.28 to $33.15 is higher in the future despite the buyer taking control of the price.
AVA Price Form a Morning Star Pattern
The AVA price has formed a morning start pattern in the weekly timeframe. It shows the bulls are highly aggressive in the current market scenario.
The high buying volume at the upper levels shows the bulls will not give up on control of the price that easily. The breakout of the $33.15 level was reliable as it was supported by a high buying pressure
However, the breakout of the $35.28 resistance level will trigger the next wave of a bull run and the price may reach its next resistance at $39.72. If it also breaks above this level, it might reach its next resistance at $42.66.
The $31.55 level will play an important role because the breakdown of this level may cause turmoil among the buyers. It will lead to panic selling and squaring off the positions by the buyers after which the price may be seen falling to its next support at $30.55. If it also breaks down this level, it may fall to test the next support at $29.00.
Conclusion
The AVA stock price prediction is bullish. However, the chances of the stock price consolidating in a range of $35.28 to $33.15 is higher. That’s because it might be difficult for the AVA price to do a V-shaped recovery after a long-term downtrend. The consolidation phase will be a good sign for the future uptrend as it will form a strong base. The overall factors shifting in favor of buyers may increase the chance of a future rise in price.
Technical levels
Resistance Levels: $35.28, $39.72, and $42.66
Support Levels: $33.15, $30.55, and $29.00
Disclaimer
The views and opinions stated by the author or any other person named in this article are for informational purposes only. They do not provide financial, investment, or other advice. Investing or trading in crypto comes with a risk of financial loss.




