
 Quack AI
 Lighter
 Pudgy Penguins
 Bittensor
 Solana
 Aptos
Aptos Quantus
- The INTC stock price is in an uptrend with a return of 1.17% during the intraday trading session.
- The oscillator showed a false internal divergence at the 32.04 level.
Intel Corporation (NASDAQ: INTC) is a semiconductor company that develops technical products and components. The company is involved in the manufacturing of microprocessors, chipsets, embedded processors, microcontrollers, etc for personal computers and data center markets around the globe. Although the firm has faced some delays in manufacturing, Intel only sells its products and solutions to original manufacturers.
INTC Stock Financials and Stock Price Movements
For the last five years, the INTC stock price has experienced a fall of 20.76%. On the other side, the year-to-date return of the stock price is 41.02% after the company reported that its previous year’s revenue amounted to $63.05 Billion with a 12.71% profit margin.
According to the reports, the highest contribution in revenue came from China and brought Intel Corporation $17.13 Billion. However, in 2022, the firm’s contribution to the world for its sales and services is lesser compared to the previous year.
In 2023, the company is observing positive profits in its quarterly statements. In the last quarter, Intel’s estimations for revenue were $13.58 Billion whereas it generated a total of $14.16 Billion, which accounts for a 4.29% surprise.
Now, the firm has estimated its fourth-quarter revenue to be $15.17 Billion, which is the highest estimation, among all 2023 quarterly statements. Meanwhile, the INTC stock price is moving in an uptrend with an EPS estimation of $0.45 in the last quarter.
Technical Analysis of the INTC Stock
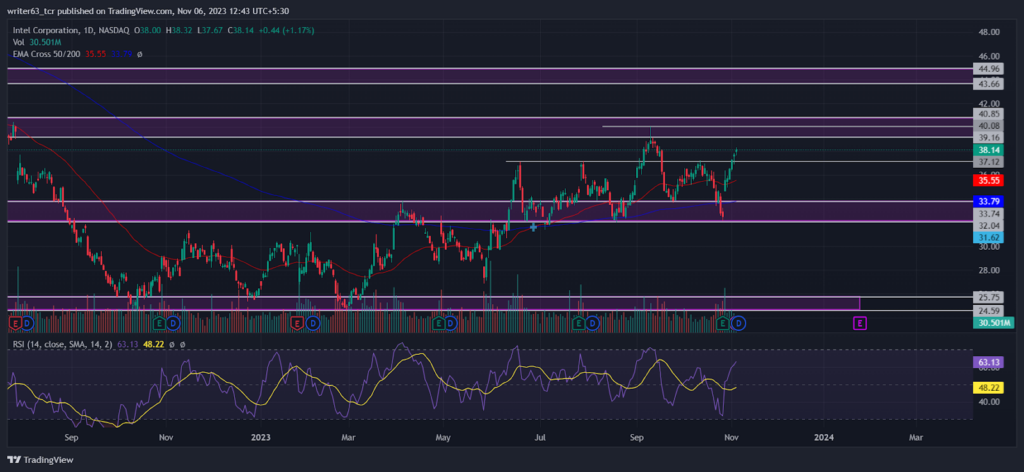
The INTC stock price took support multiple times from the 200-day EMA after a bullish crossover between the 50-day EMA and the 200-day EMA. This indicates that the 200-day EMA became a trend changer for future increases and declines. Currently, the 50-day EMA is at $35.55 and the 200-day EMA is at $33.79.
The INTC stock price broke out from a sideways range of $32.04 and $24.59. It is moving in a series of higher highs and higher lows from the $24.59 major support level. Now, the price took multiple support at the $32.04 level, which became a pivotal point for the minor changes in price trends. At press time, the INTC stock price broke above the $37.12 immediate resistance level and is moving toward the important $40.08 resistance level.
Moreover, the relative strength index (RSI) previously showed an internal bearish divergence which recently became a false signal for the bears. At present, the RSI is moving at 63.13 with strong momentum toward the 70-mark upper band.
Conclusion
The INTC stock price is moving in an uptrend from the $24.59 major support level. It broke out from the upper sideways range of $32.04 and took consistent support at that level. The price is also moving above the 50-day and 200-day EMAs, reflecting a bullish trend. At present, the INTC stock price broke above the $37.12 immediate resistance level and is moving toward the important $40.08 resistance level.
Technical Levels
- Resistance Levels: $40.08 and $44.96
- Support Levels: $32.04 and $24.59
Disclaimer
The views and opinions stated by the author, or any person named in this article, are for informational purposes only. They do not establish financial, investment, or any other advice. Investing in or trading stocks comes with the risk of financial loss.




