
 Quack AI
 Pudgy Penguins
 Starknet
 Pearl
Pearl Sui
Sui Celestia
 Quantus
- HD stock price has been giving positive returns for the last six months.
- The price is moving closer to the 50-day and 200-day EMAs.
Home Depot, Inc. (NYSE: HD) is a retailer of home improvement specialty. It operates in more than 2300 warehouses offers more than 30,000 products in the stores and is claimed to be one of the largest retailers in the world. The company offers products related to numerous building materials, home improvements, lawns, and gardens, and provides various services including home improvement installations.
Company’s Financial and Stock Price Performance
Over the last few years, the company has been performing competitively. It has been showing positivity in growth and profits. In the previous year, it reported its annual revenue to be $157.40 Billion along with net income and profit margins of $17.11 Billion and 10.87%, respectively.
However, the HD stock price suffered a huge decline of nearly 23% in 2022. This resulted in the price consolidating between the $341.62 upper level and the $264.53 lower level. During this annual session, the price is only moving between these ranges.
The HD stock price moved more than 7% after the release of the 2023 first-quarter statement. However, it observed a -2.76 % shortage in revenue compared to the estimations of $38.31 Billion.
It has reported its second-quarter revenue at $42.92 Billion, which reflects an increase of 1.71% compared to the estimations. In the current quarter, the estimated revenue is $35.27 Billion, which is lower than the previous estimations.
Technical Analysis of the HD Stock Price
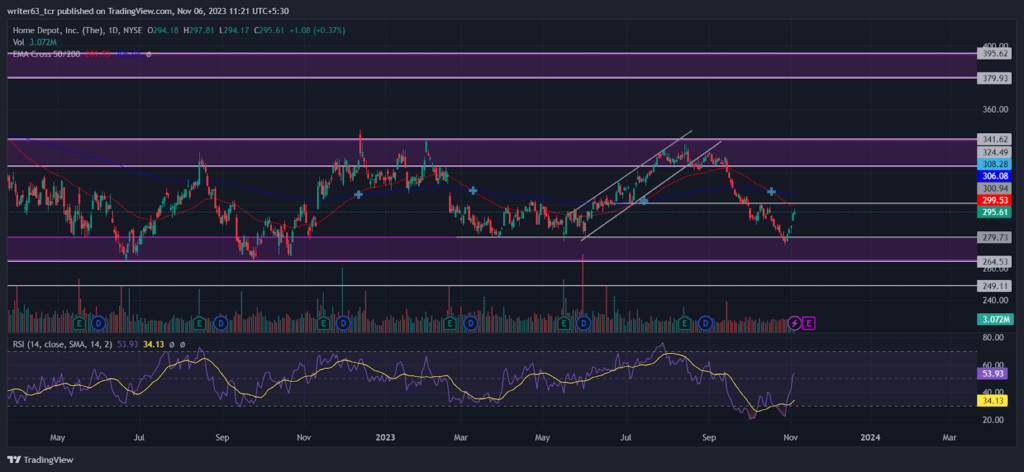
The 50-day and 200-day EMAs have converged to form a middle range for the HD stock price, indicating a period of consolidation. However, a recent bearish crossover of both EMAs suggests the presence of substantial selling pressure. Notably, the 50-day EMA is currently positioned at $299.53, which is above the current share price.
At press time, the HD stock price is at $295.61, while increasing by 0.37% during the intraday trading session. Since last year, it has been moving between a huge trading range of $341.62 and $264.53. Right now, the price has taken strong support at $279.73 near the lower range and it is moving toward the $300.94 immediate resistance level. It seems that the price may retest the $324.49 breakdown level of the ascending triangle.
Furthermore, the relative strength index (RSI) showed a bullish divergence in price momentum below the 30-mark lower band. At present, the RSI is sloping at 53.93 toward the 70-mark upper band.
Conclusion
The HD stock price is moving in a huge consolidation range between $341.62 and $264.53. Recently, it broke out from the ascending triangle and took support from the $279.73 support level. At press time, the price is moving toward the 50-day EMA and this can result in a short-term uptrend. Furthermore, the HD stock price may retest the $324.49 breakdown level of the ascending triangle.
Technical Levels
- Resistance levels: $300.94 and $341.62
- Support levels: $279.73 and $264.53
Disclaimer
The views and opinions stated by the author, or any person named in this article, are for informational purposes only. They do not establish financial, investment, or any other advice. Investing in or trading stocks comes with the risk of financial loss.




