
 hi
hi Boomer
 Lighter
 NEAR Protocol
 Covenant x402
 Pudgy Penguins
 Injective
- Berry Corp. announced its Q3 report on November 1, 2023.
- The BRY stock formed a double-top pattern after the end of the uptrend.
- It closed at $7.60, with a decrease of 1.04% in the past intraday session.
Berry Corporation’s (NASDAQ: BRY) stock price slid about 27% after the release of the Q3 report. The price fell from the intraday high of $8.01 to the low of $6.25. It triggered negative sentiment in the market. However, the price still bounced up and hit the recent resistance of $7.86 level.
The BRY stock price has closed at $7.60 while witnessing a loss of 1.04% in the past intraday session, with an opening and closing at $7.49 and $7.69, respectively. The market capitalization of Berry Corporation is $575.06 Million, with an average trading volume of 1.01 Million.
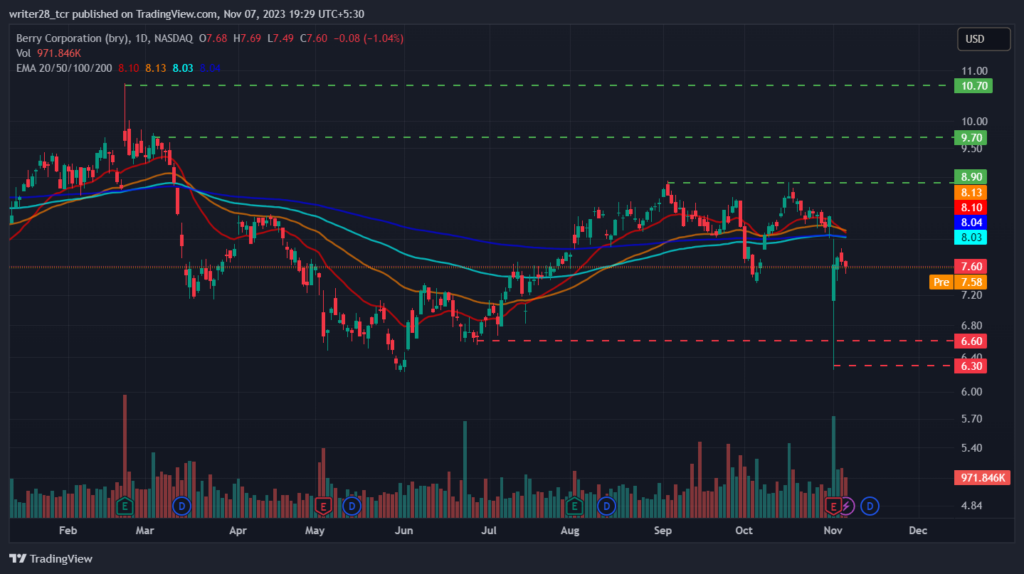
In early June 2023, the BRY stock price formed a strong support at the $6.23 level after a prolonged downtrend. However, the price observed a reversal due to the mass gathering of buyers at the annual low of $6.23. The bullish rally pushed the price in the uptrend momentum.
However, the uptrend did not sustain and halted at the $8.94 resistance level. It led to the formation of a double-top pattern where the price formed its two consecutive tops at $8.90 and the bottom at $7.36 support level. Hence, it triggers a bearish sentiment, which is still existing in the market.
Q3-2023 Report Of Berry Corp.
Berry Petroleum revealed its third-quarter financial report on November 1, 2023. The Q3 reported revenue of $188.8 million failed to meet the Zacks Consensus Estimate of $174.1. It represents a negative surprise of -31.76% and a year-to-year decline of 68.4%.
Moreover, the company has reported earnings of $0.15 per share, compared with the Zacks Consensus Estimate of $0.33, which delivered a drastic decrease of 54.55%. The negative results of the third quarter report forced the market seller to enter the market. Hence, the BRY stock price fell about 8.10% over the past week.
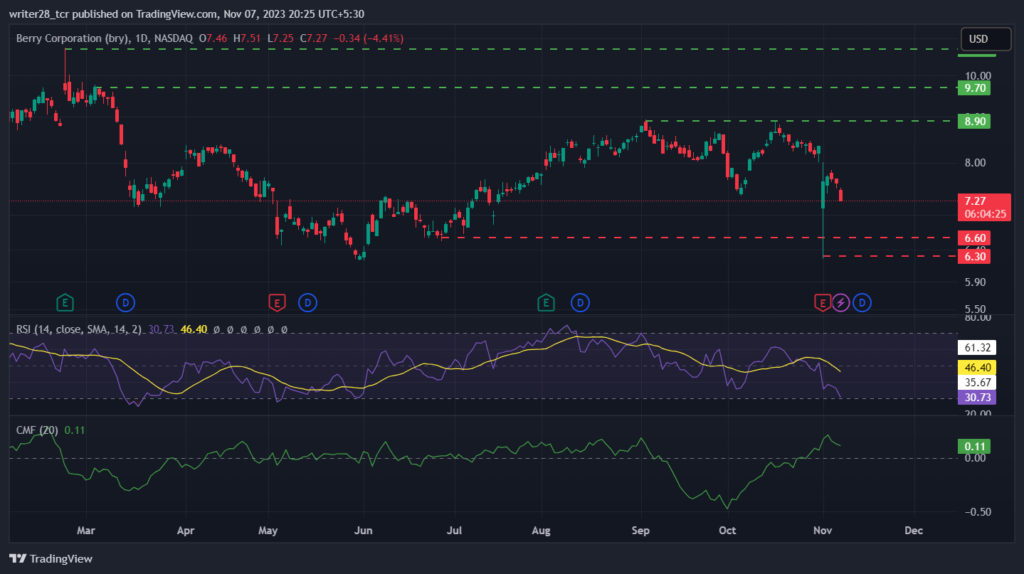
On the 1-Day chart, the NASDAQ: BRY stock price has been trending in downward momentum. Bears are attempting to reclaim the $6.30 support level. The price is hovering beneath the 20, 50, 100, and 200-day EMAs, which indicates a downtrend in the price.
The Relative Strength Index (RSI) has been hovering near the oversold territory with a score of 30.52 during the intraday session. It indicates heavy weakness, and the price might fall into an oversold zone if the bearish sentiment sustains.
Meanwhile, The Chaikin Money Flow (CMF) is trading above the 0 mark and strands at 0.12. The price might face a relief rally soon if the bulls take over the BRY stock price.
Conclusion
The recent third-quarter report release struck the BRY stock price hard. Therefore, the price barely touched the annual low due to the rise in bearish sentiment. Most of the technical indicators favor the selling side, and the analyst ratings hold a neutral stance.
Technical Levels
Significant resistance: $8.90 and $10.70
Significant support: $6.60 and $6.30
Disclaimer
The views and opinions stated by the author, or any people named in this article, are for informational purposes only. They do not establish financial, investment, or other advice. Investing in or trading crypto assets comes with a risk of financial loss.




