
 Quack AI
 NEAR Protocol
 Pudgy Penguins
 Pearl
Pearl Quant
Quant Quantus
 Sui
Sui
- BNGO stock price fell 54% in October 2023.
- BioNano Genomics stock price is in a strong downtrend.
- Quarterly earnings of BioNano Genomics were released on November 8, 2023.
BNGO stock price fell approximately 54% last month and the downfall continued. The stock price continues to decline by forming lower low swings and hitting a multi-year low.
BioNano Genomics stock price is in a strong downtrend and trading below the 50-day EMA. However, the prices are oversold and trading away from the EMA so a temporary pullback may arrive anytime.
Previously, BNGO stock price attempted multiple times to climb above the 50-day EMA. However, due to the strong presence of sellers, the attempt failed and prices reverted down.
BioNano Genomics Inc. released its quarterly earnings on November 8, 2023. It reported an EPS of negative $3.22 and revenue of $9.318 Million. However, the analyst predictions are -$0.97 and $9.08 Million respectively.
BioNano Genomics missed the EPS estimates by 232.07%. However, the stock price did not react too violently and traded on a flat basis.
At press time, sellers are dominating the BNGO shares price and building short on every rise. When most of the participants begin to play short side, then it increases the risk of a squeeze. Therefore, investors and traders need to be very careful in the coming sessions.
Will BNGO Stock Price Hold $1.00?
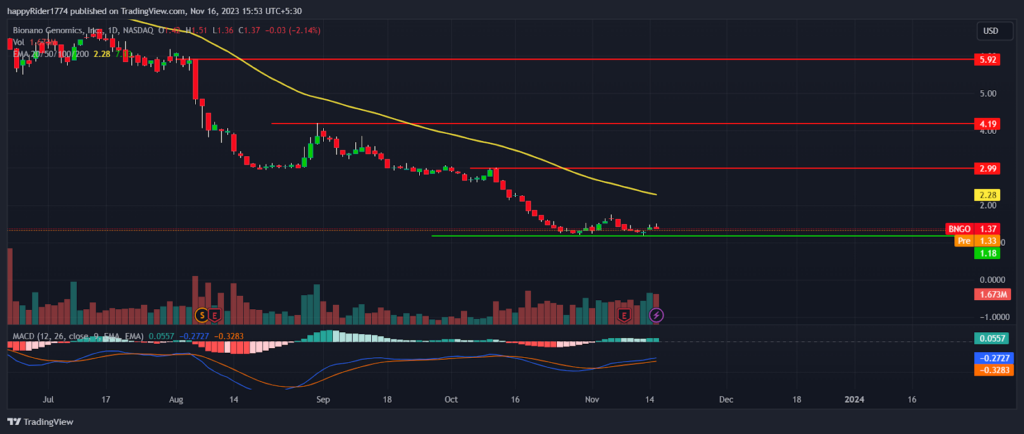
BNGO stock price is inside the bears’ grip and no reliable signs of recovery are visible. The price action tells us that short sellers are highly active but it will not be favorable to build further shorts.
Till the BioNano Genomics stock price trades below $3.00, any short-term pullback rallies will be sold off. However, if the short covering rally got extended above $3.00, then the price may reach $4.00.
The company is not profitable and financials are not up to mark so the stock price may not perform well in the future.
BioNano Genomics Stock Price is Highly Bearish
BioNano Genomics stock price is highly bearish on the multiple time frame. The sellers are ready to build shorts on every rise. Therefore, investors and traders must avoid building positions on either side.
The MACD curve slopes sideways denotes price and may spend some time into consolidation near a multi-year low.
The RSI at 34 denotes weakness and may enter into the oversold territory. The supertrend says, till the stock trades below $1.75, the trend will remain down.
Conclusion
BNGO stock price fell 54% approximately in October and eroded a big portion of the market capitalization.
The short sellers are active and building shorts on every rise. So, a squeeze may trigger any time to clear out the shorts. The analysis suggests that investors should avoid investing money in this penny stock.
Technical Levels
- Resistance levels: $2.00 and $3.00
- Support levels: $1.18 and $1.00
Disclaimer
The views and opinions stated by the author, or any people named in this article, are for informational purposes only. They do not establish financial, investment, or other advice. Investing in or trading crypto assets comes with a risk of financial loss.




