
 Quantus
 Pearl
Pearl Quack AI
 Starknet
 NEAR Protocol
 Zcash
Zcash Aerodrome Finance
- ICLK stock price has given a breakout from a year-long downtrend.
- The price crossed above the 50-day EMA, rallying for the 200-day EMA.
iClick Interactive Asia Group Limited (NASDAQ: ICLK) is an enterprise service and online marketing and data technology platform. It helps brands drive significant business, growth, and profitability throughout the full consumer cycle. The company was listed on NASDAQ in 2017 and has gained immense trust from its 3000+ direct marketers and agency clients.
Financials and the Stock Price Movements
The company has been reporting consistent growth till 2021 meanwhile the ICLK stock price has suffered an immense fall of over 75% from February to December in 2021. Consequently, that reflected some negative profitability in the 2022 annual statement.
However, the annual revenue for the year 2022 was $169.08 Million whereas the 2021 revenue was at $307.70 Million. The firm experienced a decline of 45.05% as per the year-to-year change. At present, the current year estimations are $192.24 Million
On the other side, the ICLK stock price closed below an important support of $41.42 on 20 January 2022. After the fall of more than 85% to the $5.70 support level, the investors became more cautious about taking positions.
In mid-2022, the price also broke below the $5.70 support level which was successfully retested in December 2022. And the price went below the major support of $2.12. Recently, it took immediate support on the $1.36 and is moving at $2.64.
Technical Analysis of the ICLK Stock
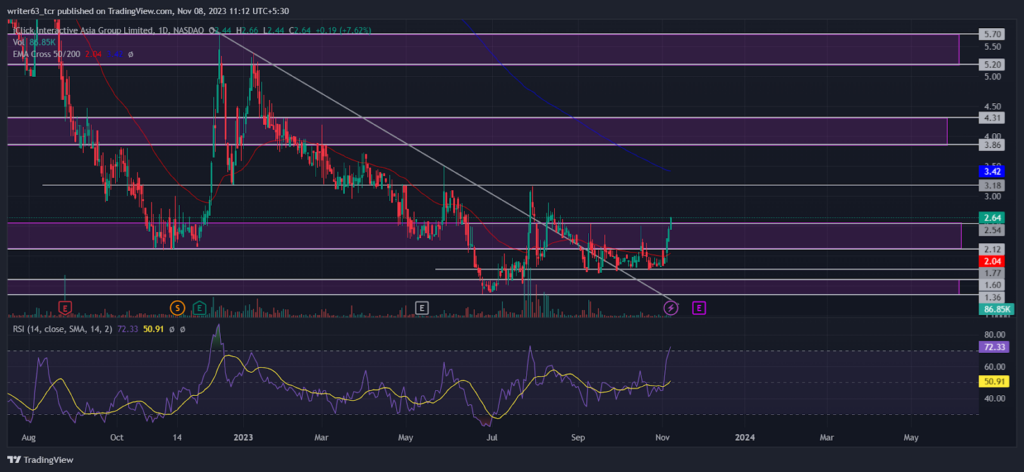
The 50-day and the 200-day EMAs are moving closer to each other. In a closer look, the price crossed above the 50-day EMA which displays the short-term uptrend. It is moving toward the 200-day EMA and it can face resistance from it. At present, the 50-day EMA is moving at $2.04 and the 200-day is at $3.42.
ICLK stock price gave a breakout from a one-year-long trendline at $2.54. From there, the price retested the trendline at the $1.77 key level. Subsequently, the price consolidated for two months between these two levels. In the last trading session, it formed a green bullish candle at the $2.54 breakout level reflecting the strong bullish presence.
Furthermore, the relative strength index (RSI) has shown internal bullish divergence in the stock price momentum. Currently, the RSI is sloping at 72.33 above the 70-mark upper band.
Conclusion
The ICLK stock price is performing in a downtrend. Recently, it gave a breakout from a year-long trendline. It also crossed above the 50-day EMA which indicates a short-term bull run. At press time, the ICLK stock price is moving toward the $3.18 immediate resistance level. If it manages to close below that level, it may reach the $3.86 resistance level.
Technical Levels
- Resistance levels: $3.18 and $4.31
- Support levels: $1.77 and $1.36
Disclaimer
The views and opinions stated by the author, or any person named in this article, are for informational purposes only. They do not establish financial, investment, or any other advice. Investing in or trading stocks comes with the risk of financial loss.




