
 Bitcoin
 Quack AI
 Pudgy Penguins
 Quantus
 Solana
 Injective
 NEAR Protocol
- UPST stock has advanced by 28% in the last five days.
- The Upstart Holdings Inc. stock has a very high beta making the share price much more volatile.
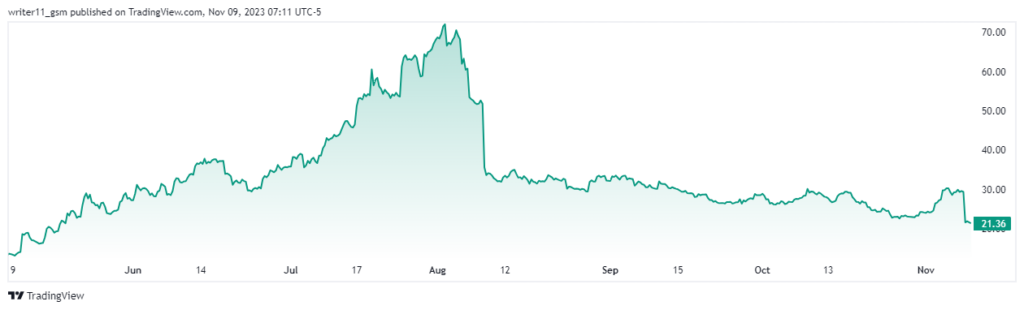
Upstart Holdings Inc. provides consumer loans using non-traditional variables. It is an AI lending platform launched in April 2012. The CEO of the company is David Joseph Girouard and has its headquarters in San Mateo. USPT has 1.875K employees working for it.
The last trading session volume of the UPST stock has breached the average of the last three months of 5.75M traded shares. The beta of the UPST stock is also too high resulting in 4.48. This shows that the stock price is highly volatile and its return might vary a lot from the market.
Upstart Holdings has 73.132M shares floating in the market and a negative net income. 15.21% of the company’s shares are closely held by the investors out of the total float of shares.
The financial ratios of the company such as ROE and ROA are also negative. The operating margin is also negative resulting in -32.58%. Despite this, company has a reliable debt/ equity ratio of 204.67%.
Upstart Holdings Inc. Stock Performance Analysis
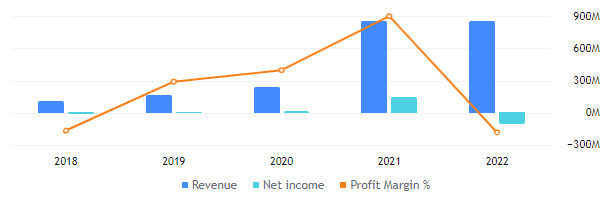
The gross profit of the company for the year 2022 is $825.931M out of the total revenue of $842.44M. Throughout the year, the company incurred operating expenses of -$113.863M. Following this, the net income of the company is -$108.665M.
End Of Fall Or USPT Stock Will Give Breakdown?
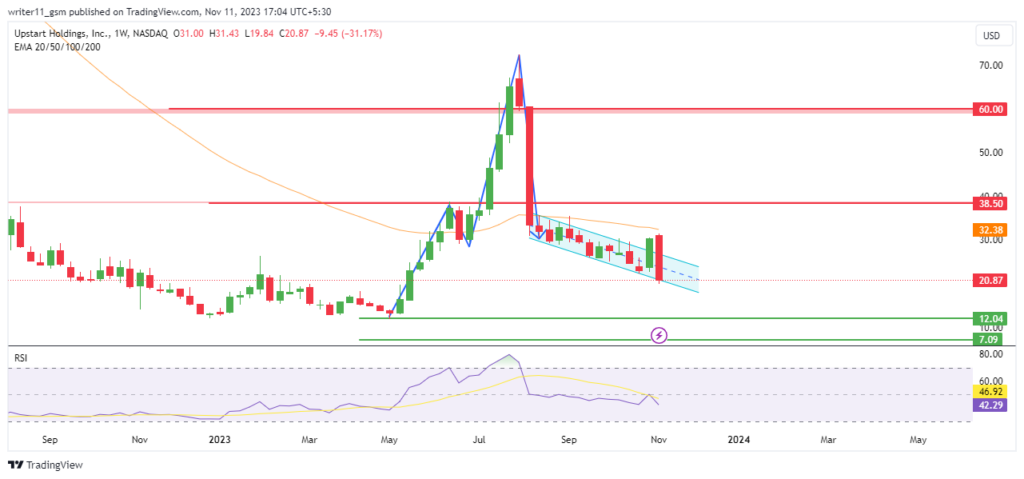
The UPST stock price has advanced by more than 450% from the low of $12.20 levels. It hit a high of $72.58 and the stock faced resistance from the levels. This further resulted in a huge sell-off and the price declined by 71.00%.
Based on the most recent price action, the USPT stock price is sliding to lower levels. It is currently trading at the lows of the wedge pattern and might take support from the lower levels.
The EMAs with the price decline have resulted in a death cross. The UPST stock price has declined by 50% from the 50-day EMA.
The RSI on the daily chart of the UPST stock price is trading below the 50-level. It is currently trading at 35.31 and the 14-day SMA is at 41.69. This shows that the sellers have dominated the price and is declining to new lows.
Conclusion
UPST stock surged 450% from $12.20 to $72.58 but faced strong resistance, leading to a 71% decline. Current indicators, including a death cross, a 50% drop from the 50-day EMA, RSI at 35.31, and negative financials, suggest a bearish trend. High volatility (beta 4.48) and negative margins add to concerns.
Technical Levels
- Support levels- $7.00 and $12.00
- Resistance levels- $38.50 and $60.00
Disclaimer
The information provided in this article, including the views and opinions expressed by the author or any individuals mentioned, is intended for informational purposes only. It is important to note that the article does not provide financial or investment advice. Investing or trading in cryptocurrency assets carries inherent risks and can result in financial loss.




