
 Minter
 Quack AI
 Pearl
Pearl Monero
 The Sandbox
 Pons
Pons Bittensor
- Roper Technologies, Inc. pays timely dividends to its shareholders.
- ROP stock has shown a return of over 23% in the previous year.
Roper Technologies, Inc. (NASDAQ: ROP) operates as a diversified technology company, offering engineered products and solutions for niche markets on a global scale. The company is segmented into Application Software, Network Software, and Technology Enabled Products.
Technical Analysis:
The current path of ROP stock suggests an upward trend, marked by the formation of higher highs.
With a dividend payout ratio of 23.11% and a dividend yield of 0.53%, the company consistently rewards its shareholders, showcasing a solid financial standing.
ROP stock delivered an impressive return of 23.53% in the previous year. Additionally, the technical indicator summary signals a ‘buy’ for the stock, with the majority of the 26 indicators providing a ‘buy’ signal.
The company’s actual earnings surpass estimated earnings, reflecting a growth of approximately 2.3% from the expected figures, indicating strong financial performance.
Recently, ROP stock broke out of the ascending triangle pattern, which is a positive signal. The price surged by around 5% in the last week, reaching an all-time high. The overall structure of the stock appears positive, suggesting a potential rise in the coming days.
The target price for ROP stock in the upcoming year is forecasted to be $549.53, signifying a 7.45% increase from the current price. This positive projection indicates an optimistic outlook for favorable returns.
Roper Technologies, Inc. (ROP) Stock Price Analysis
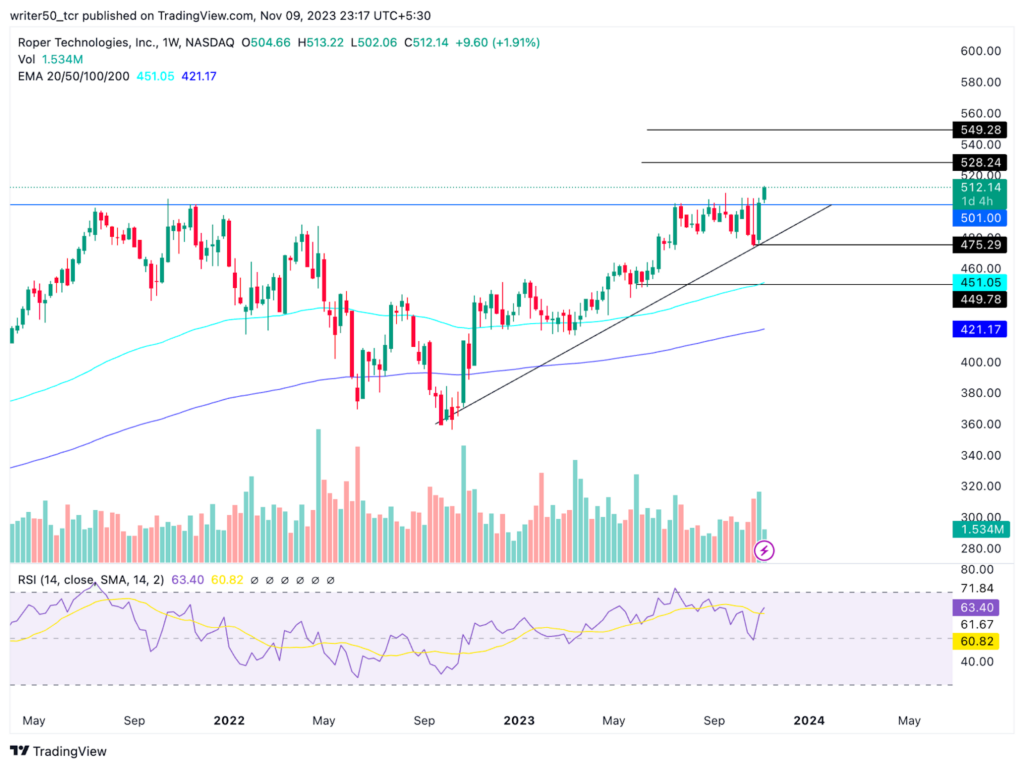
ROP stock is presently situated above both the 100-day and 200-day EMAs, indicating a favorable sign for potential price increases in the coming days.
The RSI line for ROP stock stands at 63, closely accompanied by the SMA line at 60. The RSI line is above the SMA line, having formed a positive crossover. As a result, there is an anticipation of a price increase in the upcoming days.
Conclusion
As per the analysis, it is clear that ROP stock is on an upward trajectory. The price has reversed upon reaching a support level and is currently forming a triangle pattern. Positive indicators and a general increase in earnings indicate the potential for an increase in the stock price in the days ahead.
Technical Levels:
· Support Level– $575and $449
· Resistance Level- $528 and $549
Disclaimer
The views and opinions of the author or anyone in this article are for informational purposes only. They do not offer financial, investment, or other advice. Investing or trading crypto assets involves the risk of financial loss.




