
 Minter
 Quack AI
 STONK
STONK Pons
Pons Sui
Sui Pearl
Pearl Bittensor
- Gartner Inc.’s actual earnings is more than the expected earnings, representing a good financial performance.
- IT stock has a target of $418.58 for the upcoming year.
- The finances of the company are showing a positive signal.
Gartner, Inc. (NYSE: IT) serves as a research and advisory firm, providing business leaders with insights, guidance, and resources to facilitate organizational development. The company operates across distinct segments, namely Research, Consulting, and Conferences.
IT stock is currently moving in an uptrend. The stock has shown an impressive return over the last few weeks.
Technical Analysis:
The price of IT stock is currently at $401.14, with a rise of 0.82% in today’s market session. The company has a volume of 748K and a market cap of $31 Billion.
The target price for IT stock in the upcoming year is anticipated to reach $418.58, reflecting a 4.35% increase from the current price. This positive target indicates an optimistic expectation for favorable returns.
The stock price exhibited a return of over 20% in the previous week, contributing to a one-year return of 20%. This performance underscores the company’s success in the past year, enhancing its overall reputation.
The company’s expected earnings surpass the estimated earnings by more than 30%, signaling a strong financial performance.
Recently, the price of IT stock experienced a breakout from the descending triangle pattern, reaching an all-time high of $401.42. The overall structure of the stock appears positive, suggesting a potential further rise in the upcoming days.
Gartner Inc. (IT) Stock Price Analysis
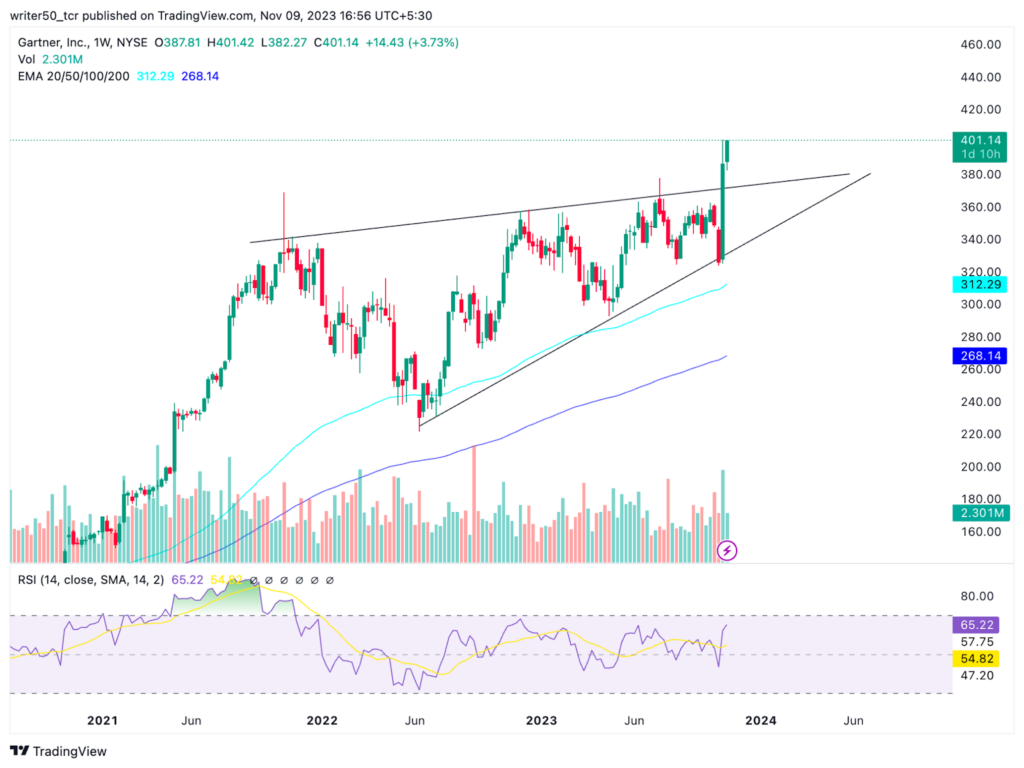
The price of IT stock is trading above the 100-day and 200 EMA levels. This is considered as a positive signal and this indicates that the price is likely to rise in the upcoming days.
The RSI line for IT stock is at 64 and the SMA line is near 4. The RSI line is above the SMA line, and both the lines have formed a positive crossover. Hence, the price is expected to rise in the upcoming days.
Conclusion
In conclusion, IT stock is moving in an uptrend. The price has shown a breakout from the triangle pattern and has marked a fresh all-time high. The indicators are positive for the stock and the overall earnings are increasing. Hence, the price is expected to rise in the upcoming days.
Technical Levels:
- Support Level– $366 and $340
- Resistance Level- $410 and $$420
Disclaimer
The views and opinions of the author or anyone in this article are for informational purposes only. They do not offer financial, investment, or other advice. Investing or trading crypto assets involves the risk of financial loss.




