
 Quack AI
 NEAR Protocol
 Quant
Quant Quantus
 Pearl
Pearl Ondo
Ondo Bitway
- Among the top 5 losers, Render (RNDR) is the largest cryptocurrency.
- Despite the decline, cryptocurrencies have a strong potential to give multifold returns.
The sentiment of the overall crypto market looks bullish, as most cryptocurrencies have been trading in green over the last week.
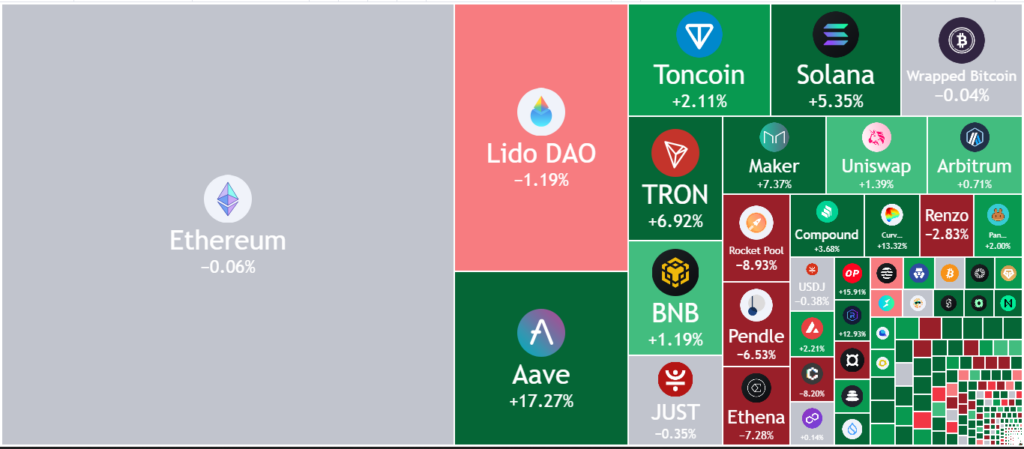
Despite a bullish outlook in the crypto market, some crypto prices have stagnated and declined in the last few days. This shows that a few options remain in the market, which might join the overall market trend.
Let’s look at the token’s top 5 losers, which were the underperformers and witnessed a decline in price over the last week.
1. Render
One of the largest tokens of the five cryptocurrencies, Render has a market cap dominance of 0.10%, which represents its strong market presence.
A surge of 67% in the value of the traded volume for the token is recorded in the last 24 hours from the press time in the token. This has resulted in a volume/market cap ratio of 8.70%, which shows good liquidity.
RNDR/USD Chart by TradingView on
RNDR was trading inside a descending triangle pattern for a long time. On 04th of July, 2024, the token price broke down below the pattern. The following behavior regarding the price has led to the invitation of more sellers to the token.
The following behavior of the price shows that the token might lead to more discounted prices in the upcoming days.
2. dogwifhat
The fear and greed index of the dogwifhat token is at 25, representing extreme fear among the token investors. It has a total of 155K holding addresses, and the top 10 holders of the token have 32.85% of the supply.
>WIF/USD Chart by TradingView
WIF chart exhibits a strong bearish structure, characterized by the formation of lower highs on the daily chart. This pattern indicates a prevailing downtrend and a lack of bullish momentum.
Recently, WIF formed a symmetric triangle pattern, which was subsequently followed by profit booking from higher levels. The selling pressure continued, causing the price to decline below the pattern, reinforcing the bearish outlook.
3. Flare
A decline of 17% in the value of the traded volume of the FLR is recorded over the last 24 hours from the press time. This has resulted in a traded value of $11.035 Million, which is just 1.39% of its market cap.
FLR/USD Chart by TradingView
The FLR cryptocurrency has experienced significant profit booking over the past few days, resulting in a decline of over 60% from its swing high of $0.05600. This substantial drop underscores the recent selling pressure on the asset.
For more than four months, the price of FLR has been consistently declining. This prolonged downtrend has led to the formation of a falling wedge pattern on the daily chart, indicating a potential bearish continuation.
The persistent decline highlights the challenging market conditions currently facing the FLR cryptocurrency.
4. Ondo Finance
The sentiment for ONDO is bearish, as per the analysts, and the fear and greed index also shows extreme fear in investors. Despite this, the token has a strong market presence, resulting in a market cap dominance of 0.06%.
ONDO/USD Chart by TradingView on
ONDO token has experienced significant profit booking from its recent high of $1.4840, resulting in a decline below a crucial trendline. This marks a notable shift in the token’s previously sustained uptrend.
For an extended period, the ONDO was in an uptrend, which led to the formation of a rising wedge pattern on the chart. However, profit booking began at the beginning of June 2024, causing the token’s price to decline by 35%.
As of now, the token’s price is below the rising wedge pattern. If the price rebounds to the $1.3 level and sustains above it, there is potential for a future surge in the ONDO token’s value.
5. Brett
At press time, 99.10% of the maximum supply of the token is circulating in the market. This is followed by a maximum supply of 10.0B BRETT, which results in a fully diluted market cap of $1.087 Billion.
BRETT/USD Chart by TradingView
Over the last five months, Brett consistently experienced profit booking, resulting in a 40%+ decline in its price. This trend reflects ongoing selling pressure and a shift in market sentiment.
During this period, BRETT moved within a dynamic range, forming a falling wedge pattern. Eventually, the price broke below this pattern, indicating a strong bearish character.
Disclaimer
This article is for informational purposes only and does not provide any financial, investment, or other advice. The author or any people mentioned in this article are not responsible for any financial loss that may occur from investing in or trading. Please do your research before making any financial decisions.




