
 Dacity Coin
 Bitcoin
 Pearl
Pearl NEAR Protocol
 Quantus
 Bittensor
 Pudgy Penguins
- The Graph Token (GRT) has outperformed 52% of the top 100 crypto assets in the last 1 year.
- GRT is down by 93% from its all-time high price.
The market cap dominance of GRT is 0.08%, which highlights its strong market presence.
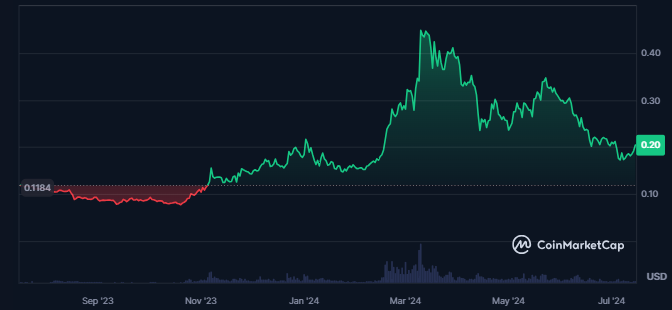
GRT is highly volatile (8.94%) while the supply inflation of the token is medium resulting in 4.81%.
The market cap value of GRT is $1.952 Billion. It rose by 8.3% in the last 24 hours from press time, making it the 47th largest cryptocurrency in the global crypto market.
Following the surge in market cap, traded volume for the token has also advanced by 17.8%. This shows a surge in the demand for the token in the crypto market among investors and traders.
Despite the surge in the trading volume, the liquidity of the token is low (2.52%). Also, the circulating supply of the token is 8.548 Billion GRT followed by a maximum supply of 10.799 Billion GRT.
Financial Data Overview of the Graph Token
The Graph token has a total of 163K holders and the top 10 holders hold 58.22% of the supply. Also, the largest token holder of the token has 2.806 Billion GRT which is 28.07% of the circulating supply.
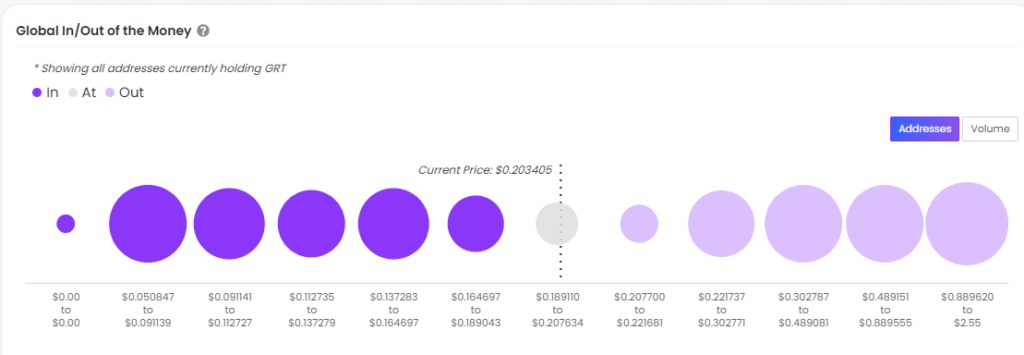
The Graph token’s 46.9% of the holders are in profit resulting in 75.1K addresses. Despite this, there are 81.58K Out of the money addresses which is 50% of the total holders.
Also, the large holders concentration in the token is very high resulting in 83% and 64% of the holders of the token have held it for more than 1 year.
GRT Token Technical Analysis
In the last few days, GRT underwent a good amount of buying which reflected in the price surge.
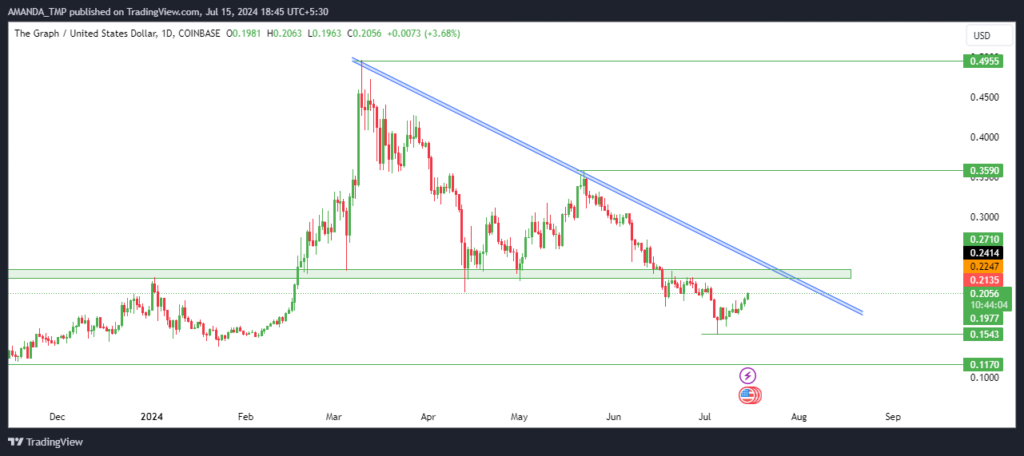
After advancing to certain highs, GRT started to witness profit booking from the swing high of $0.4963. The declining momentum triggered a decline of 65% in the trading price of the token.
The following losing behavior of the price led to the formation of a dynamic trendline and also a strong change of character to bullish level.
If the token breaks above the dynamic trendline and the change of character level with good momentum, It will lead to a change in character to bullish. This will result in inviting more buyers in the market.
GRT/USD CHart by TradingView
The price of GRT has declined below the 50-day and 200-day EMAs following which the EMAs are trading in a death cross. This exhibits a strong bearish character in the price of the token.
The supertrend on the charts also has given a sell signal following and the MACD and the signal line are trading in a negative trajectory.
The RSI broke above the 14-day SMA and hit the 50-level at press time. If the RSI value further breaks above the 50-level and sustains, it would indicate that bulls are picking up strength.
GRT token has shown impressive market performance despite being 93% below its all-time high.
With the top 10 holders controlling 58.22% of the supply, its price remains volatile. Recent technical indicators suggest a potential bullish shift if the price breaks key resistance levels, although uncertainty persists.
The support levels for GRT are $0.1170 and $0.1540 followed by the resistance levels of $0.350 and $0.490.
Disclaimer
This article is for informational purposes only and does not provide any financial, investment, or other advice. The author or any people mentioned in this article are not responsible for any financial loss that may occur from investing in or trading. Please do your research before making any financial decisions.




