
 Bitcoin
 Solana
 Pearl
Pearl Zerebro
 Aerodrome Finance
 LayerZero
 NEAR Protocol
- At press time, Fantom (FTM) price was down by 87% from its all-time high price.
- The supply inflation of FTM was a disappointing 0.05%.
The fear and greed index of Fantom was at 39 as per Coincodex suggests investors are avoiding the token.
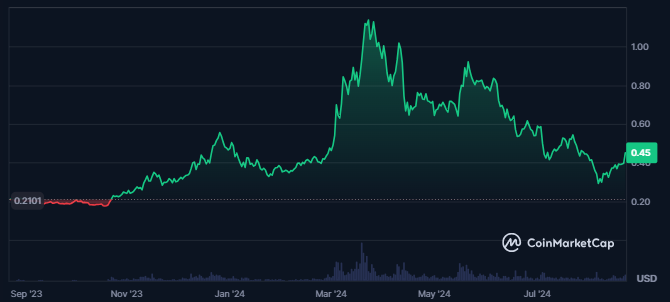
Price Overview Chart of FTM | Source: CoinMarketCap
FTM displayed sharp volatility at 13.75%. The token’s market cap value was further advanced by 12% in the last 24 hours resulting in a market cap value of $1.266 Billion.
At press time, Fantom was the 57th largest cryptocurrency in the global crypto market which resulted in a market cap dominance of 0.06%. The traded volume also advanced by 115% in just the last 24 hours resulting in a traded value of $206.824 Million, reflecting a sharp demand surge.
FTM had a total of 172.61M holding addresses and its largest holder alone held 80.02% of the maximum supply. This showed a strong concentration of large holders in the token. Also, 37% of the token’s holders were in profit while 57% of them were out of money.
Fantom Token Derivatives Data Analysis
The derivatives traded volume of the Fantom also advanced by 115% in the last 24 hours which showed the rise in token demand. This resulted in a traded value of $726.48 Million which was much higher than the spot traded volume.
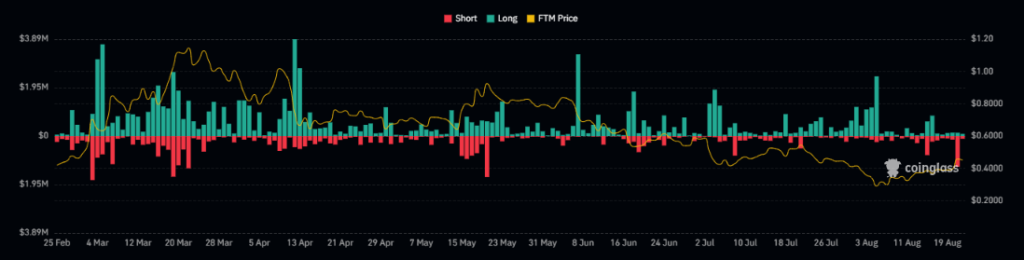
Additionally, in the last few days, higher value of shorts were liquidated which showed that bulls are gaining. Moreover, in the last 24 hours shorts worth $1.19 Million were liquidated against which the longs of only $203.16K were liquidated.
The open interest of the Fantom token also advanced by 31% in the previous 24 hours from the press time resulting in $149.94 Million.
FTM Token Technical Analysis
The daily chart of the FTM token reveals a persistent sell-off over the past few months, characterized by a series of lower lows. This price action underscores strong downtrend, with the token’s value declining below key levels and finding support at a non-mitigated swing level.
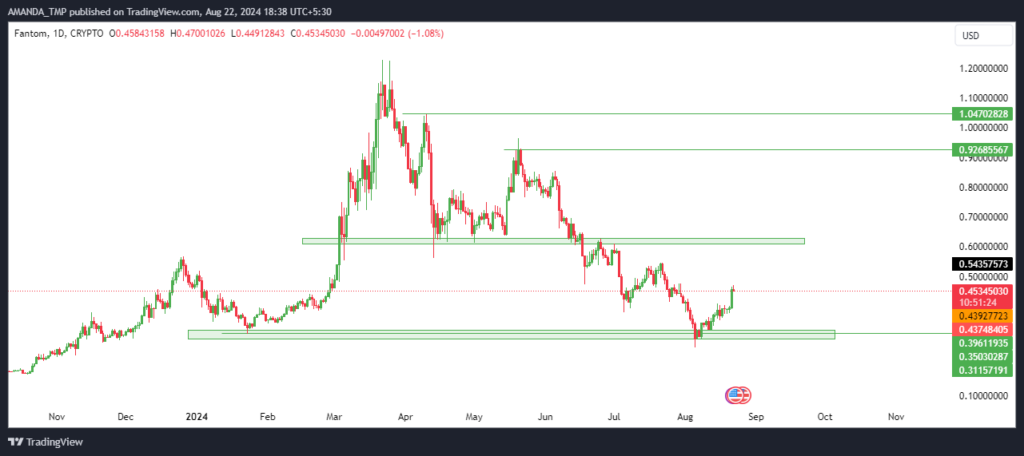
As FTM attempts to recover, it faces significant resistance at higher levels. If the price manages to break through the $0.65 resistance level and sustains above it, there is potential for a continuation of the upward trend. However, without a decisive break, the token may struggle to maintain its momentum.
Fantom Token Technical Indicator Analysis
The technical indicators for the FTM token reflect a prevailing bearish trend. This sentiment is reinforced by the crucial Exponential Moving Averages (EMAs) forming a death cross, a pattern that typically signals further downside potential. FTM is below both the 50-day and 200-day EMAs, indicating sustained selling pressure.
FTM/USD Chart by TradingView
The MACD (Moving Average Convergence Divergence) metrics have been entrenched in negative territory for an extended period, showing no signs of a bullish reversal.
Meanwhile, the Relative Strength Index (RSI) has also lost momentum, following a bearish cycle. At press time, the RSI stood at 40.41, suggesting that the token is nearing oversold conditions but has not yet reached a critical threshold that might trigger a rebound.
The FTM token price might witness support at the levels of $0.20 and $0.250 followed by the resistance levels of $0.630 and $1.040.
Disclaimer
This article is for informational purposes only and does not provide any financial, investment, or other advice. The author or any people mentioned in this article are not responsible for any financial loss that may occur from investing in or trading. Please do your research before making any financial decisions.




