IGNITION
 streamoors
 Injective
 NEAR Protocol
 Pearl
Pearl LayerZero
 Quantus
- ADA’s TD Sequential buy signal and MACD crossover hint at a potential bullish reversal.
- Stochastic RSI in the overbought zone suggests a possible pullback if resistance at $0.72 holds.
- ADA price holds $0.70 support with rising 24h volume but must break $0.72 for a strong uptrend.
Recent technical market signals indicate Cardano price is prepared to reverse course. The recent bearish market trends are fading according to market sentiment.
The combination of TD Sequential and MACD and Stochastic RSI provides information about current market conditions and ADA price predictions.
Bullish Signals from TD Sequential and MACD
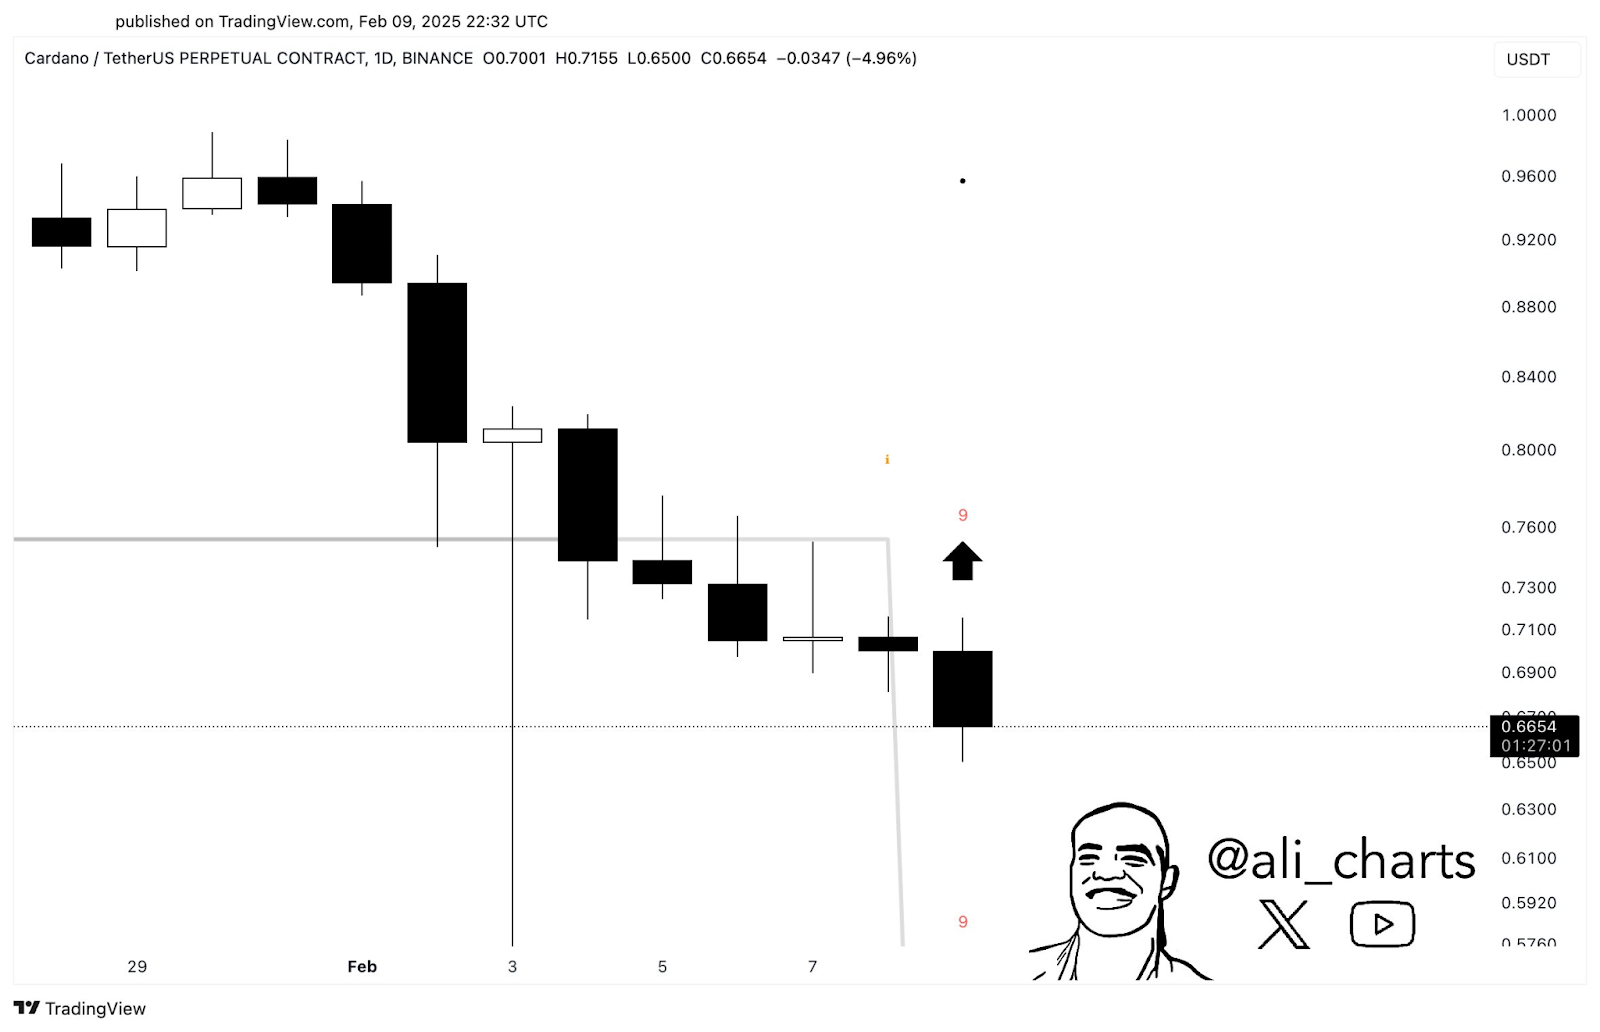
According to analyst Ali Martinez, Cardano price displays signs of a potential rebound, as indicated by the TD Sequential indicator flashing a buy signal on the daily chart.
The TD Sequential is a technical analysis tool often used to identify potential trend reversals or continuation patterns.
Ali shared a chart indicating that ADA price action may be gearing up for a bullish recovery and candlesticks show lower wicks.
This development comes after a notable downward trend, raising optimism among traders and investors.
The buy signal on the TD Sequential typically appears after a period of price exhaustion, indicating that selling pressure may have diminished.
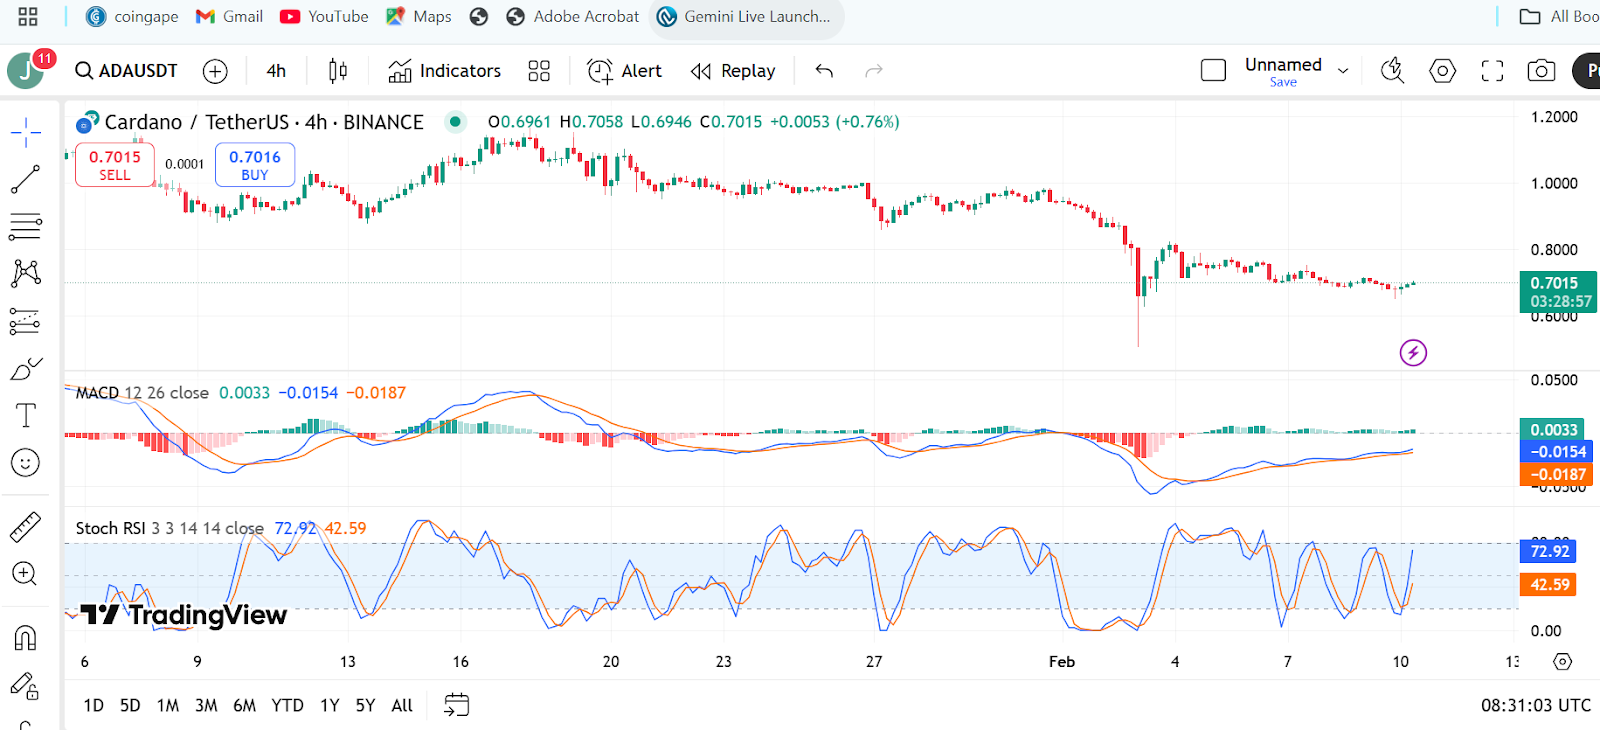
To further complement this, the Moving Average Convergence Divergence (MACD) indicator shows signs of a bullish crossover.
Its MACD line is moving toward the signal line from a lower position, reinforcing the upward momentum.
The MACD histogram maintains minimal negative value but shows decreasing divergence which signals reduced selling power. The signals suggest Cardano price will potentially increase its value when current trends continue their upward trajectory.
Stochastic RSI Shows Overbought Conditions
On the other hand, the Stochastic RSI momentum indicator shows ADA price entering an overbought territory.
The indicator shows bullish momentum potentially reaching its highest point because both %K and %D values approach critical points.
Overbought market conditions usually indicate that price levels could experience a correction along with temporary declines due to buying resistance.
The key resistance point at $0.72 needs attention as it sets an important boundary for price movement.
ADA price may face either a period of stabilization or downward movement before attempting another price rise if it fails to surpass $0.72.
A break above the $0.72 price level would offer traders opportunities to move forward toward additional resistance areas.
Cardano Price Holds Key Support Amid Volume Growth
More so, Cardano price maintains stability at the $0.70 price level which has endured multiple market fluctuations over recent trading periods.
The market displayed increased trading volume which has risen greatly in the past 24hrs. The rising trading volume demonstrates that traders are showing growing interest before potential price fluctuations.
At press time, Cardano (ADA) price is trading at $0.7008, reflecting a 0.72% decline in the past 24 hours. The price experienced fluctuations, dipping below $0.66 before recovering toward the $0.70 level.
The 24-hour trading volume surged by 46.39% to $776.2 Million, indicating increased market activity.
ADA’s market cap stands at $24.66 Billion, with a total supply of 44.99 billion ADA. The price remains near key levels, with resistance at $0.72 and support around $0.70.
Disclaimer
This article is for informational purposes only and provides no financial, investment, or other advice. The author or any people mentioned in this article are not responsible for any financial loss that may occur from investing in or trading. Please do your research before making any financial decisions.