Quantus
 Injective
 Bitcoin
 Quant
Quant Pudgy Penguins
 Raydium
 Bittensor

Key Insights:
- Bitcoin funding rates flip negative, echoing past rally signals
- MVRV dips near 1.0, short-term pain may signal market bottom
- U.S. gov’t moves 97.18 BTC, fueling sell-off speculation
In the last two years, Bitcoin’s funding rates have gone negative many times. As Bitcoin Magazine PRO chart shows, this is a trend that occurs when more traders are shorting Bitcoin. At funding rates below 0.00%, short sellers pay a fee to long holders. This is bearish sentiment in the futures market.
Moreover, six moments are highlighted in the chart where funding rates turned sharply negative. The biggest drop was near -0.050% in late 2022. Shortly after, Bitcoin started to rise. And the same pattern repeated in early 2023 and then again in 2024.
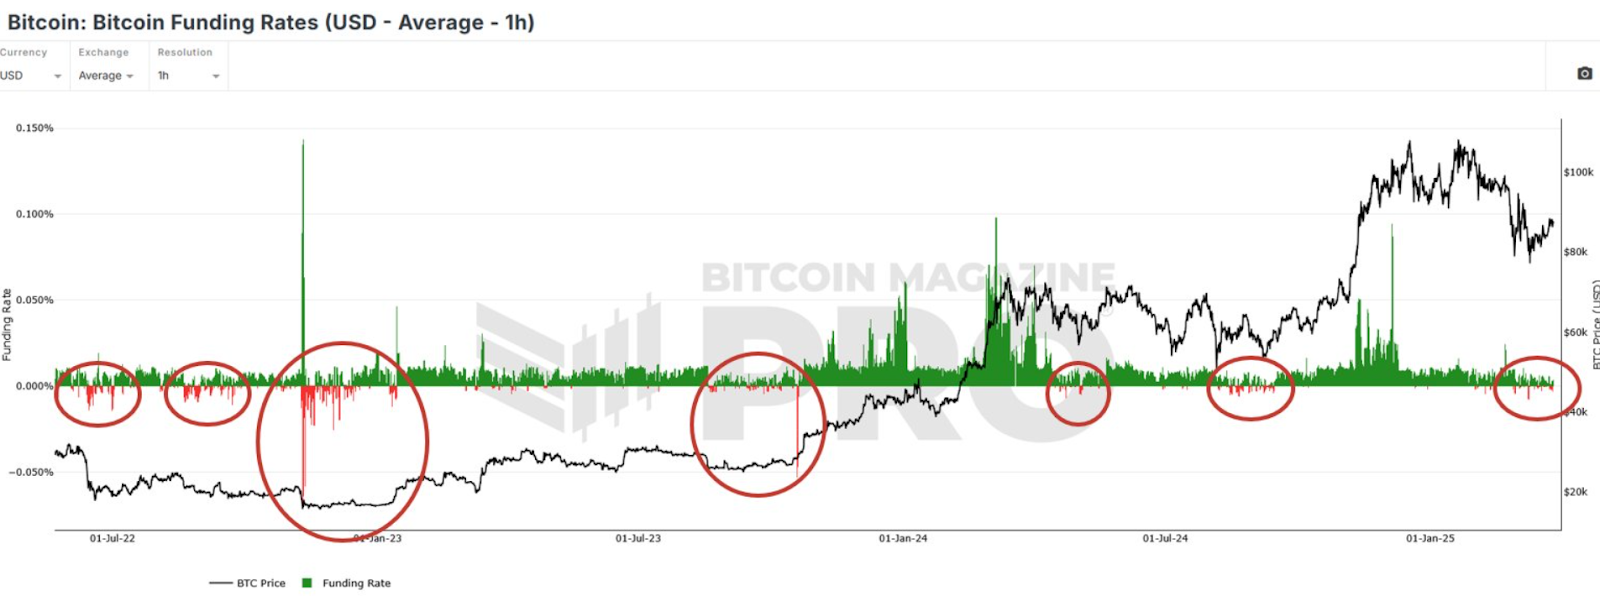
Every time, the negative funding rates would be followed by rising prices, including the move past $100,000 in late 2024. Traders are cautious as funding rates have turned slightly negative again as of March 2025. But similar setups in the past have resulted in new price rallies.
Short-Term Holder Metrics Signal Repeated Trends
Meanwhile, CryptoQuant’s chart shows Bitcoin’s price with the MVRV ratio for short-term holders. It is the ratio of market price to the average price at which recent investors bought Bitcoin. When it goes below 1.0, it means a lot of short-term holders are holding coins at a loss.
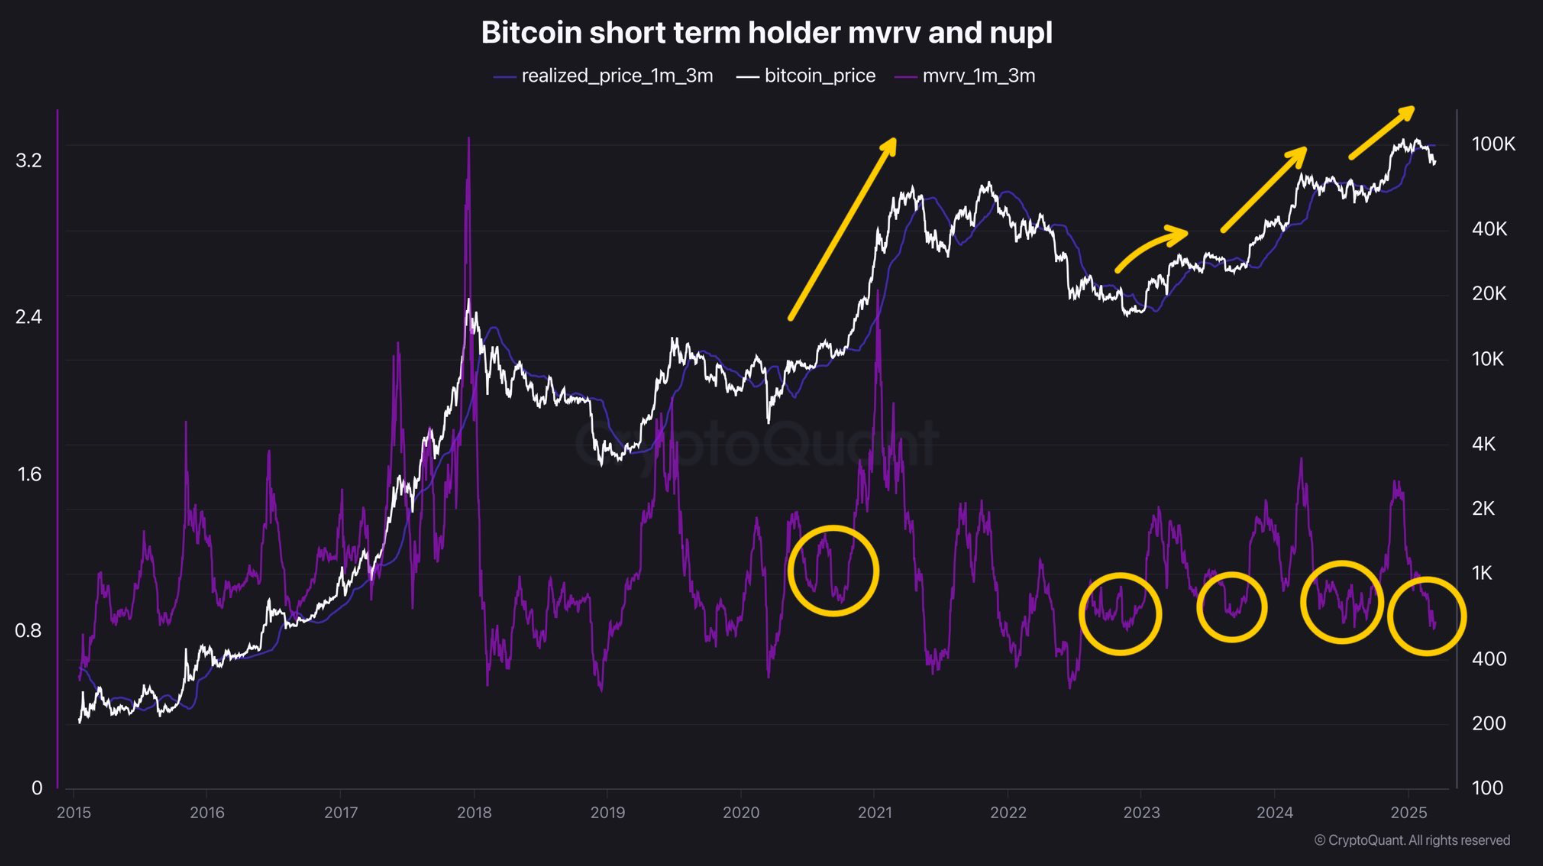
In 2022 to early 2025, there are four recent dips in the MVRV ratio. Every time, the price increased after these lows. For example, Bitcoin rose from below $30,000 to over $60,000 after the early 2023 MVRV dip. The purple line of MVRV repeats the cycle of dipping below and recovering above 1.0.
The MVRV is close to another low as of now. Similar setups in the past have led to upward price movement, as shown in the price chart.
Bitcoin’s Market Share in Global Money Supply
According to Coinvo, Bitcoin’s total market capitalization was $1.7 trillion as of March 2025. This makes Bitcoin 1.3% of the world’s total money supply. The $108.2 trillion in fiat currencies dwarfs the $21.9 trillion in hard money like gold and Bitcoin.
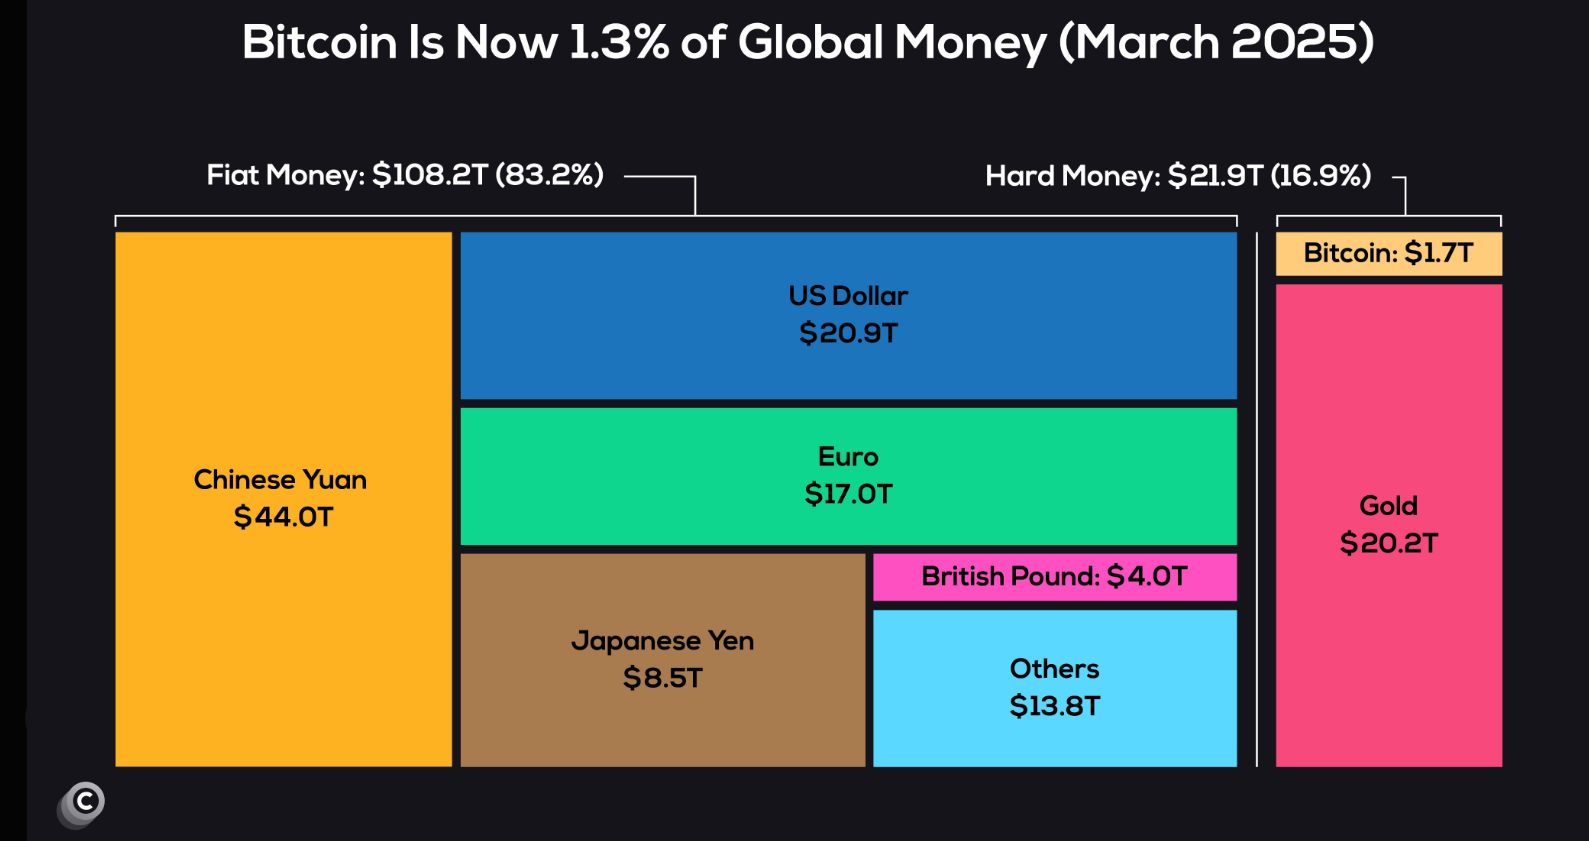
Bitcoin’s current market cap is small compared to gold ($20.2 trillion) and the Chinese yuan ($44.0 trillion), but it now surpasses currencies like the British pound ($4.0 trillion) and Japanese yen ($8.5 trillion). The US dollar remains dominant with a value of $20.9 trillion.
While Bitcoin’s current market cap is small compared to gold ($20.2 trillion) and the Chinese yuan ($44.0 trillion), it is now closer to the British pound ($4.0 trillion) and Japanese yen ($8.5 trillion). The US dollar is also dominant, with a value of $20.9 trillion.
The data indicates that Bitcoin is making headway among major global assets. While Bitcoin’s share of total fiat and hard money still represents a small portion, its rising share suggests wider adoption and more institutional interest.
U.S. Government Moves Bitcoin Holdings
Furthermore, according to on-chain data from Arkham, the U.S. government currently owns around 190,199 BTC, which is roughly $17.23 billion. The government’s digital asset portfolio is worth more than $17.6 billion, including USDT, ETH, BNB and other tokens.
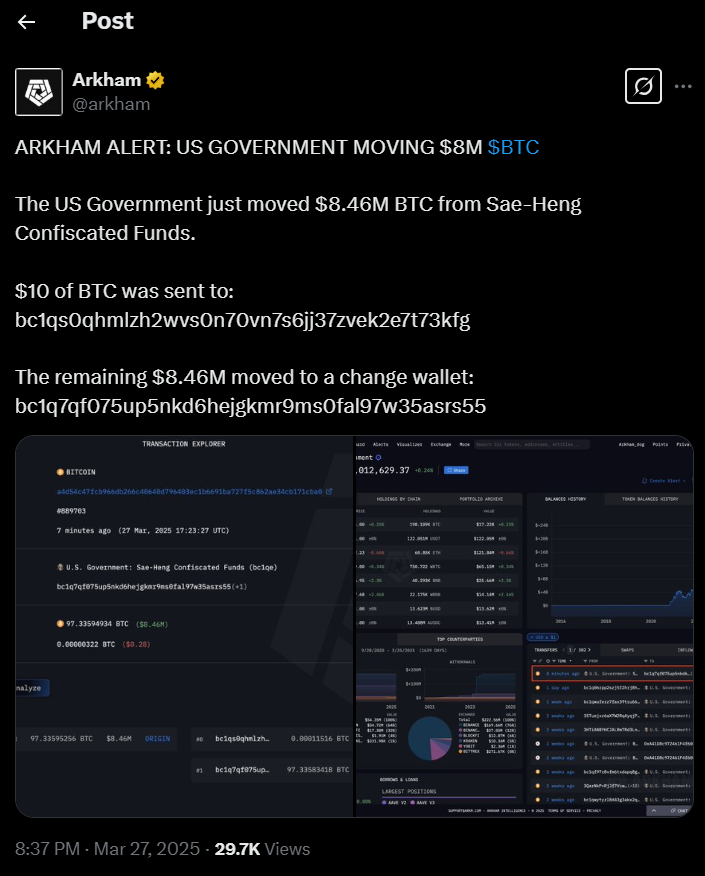
The U.S. government moved 97.18 BTC, worth $8.4 million, in a recent transaction. Unlike previous movements, the latest transfer did not lead to any official announcements about a sell off or an auction.
Disclaimer
This article is for informational purposes only and provides no financial, investment, or other advice. The author or any people mentioned in this article are not responsible for any financial loss that may occur from investing in or trading. Please do your research before making any financial decisions.