Minter
 Pearl
Pearl NEAR Protocol
 Pons
Pons Quack AI
 Quantus
 Sui
Sui

Key Insights:
- Long-term holder NUPL drops, signaling rising market fear
- ETH ETFs see inflows after two weeks of heavy outflows
- Ethereum price nears a crucial four-year trendline support
As fear spreads among long-term holders, NUPL has entered capitulation, and Ethereum’s price has fallen below $1,850. On the other hand, ETF flows have turned green after weeks of red, a sign of early institutional tread.
Long-Term Holders Show Fear as Ethereum Price Falls
Data from Glassnode shows that Ethereum’s Long Term Holder Net Unrealized Profit/Loss (NUPL) has dropped from 0.52 on February 1 to around 0.17 by March 30. This has brought the sentiment from the ‘Optimism–Anxiety’ zone to the ‘Fear–Capitulation’ zone. Unrealized profits are now shrinking and long term holders are starting to look uneasy.
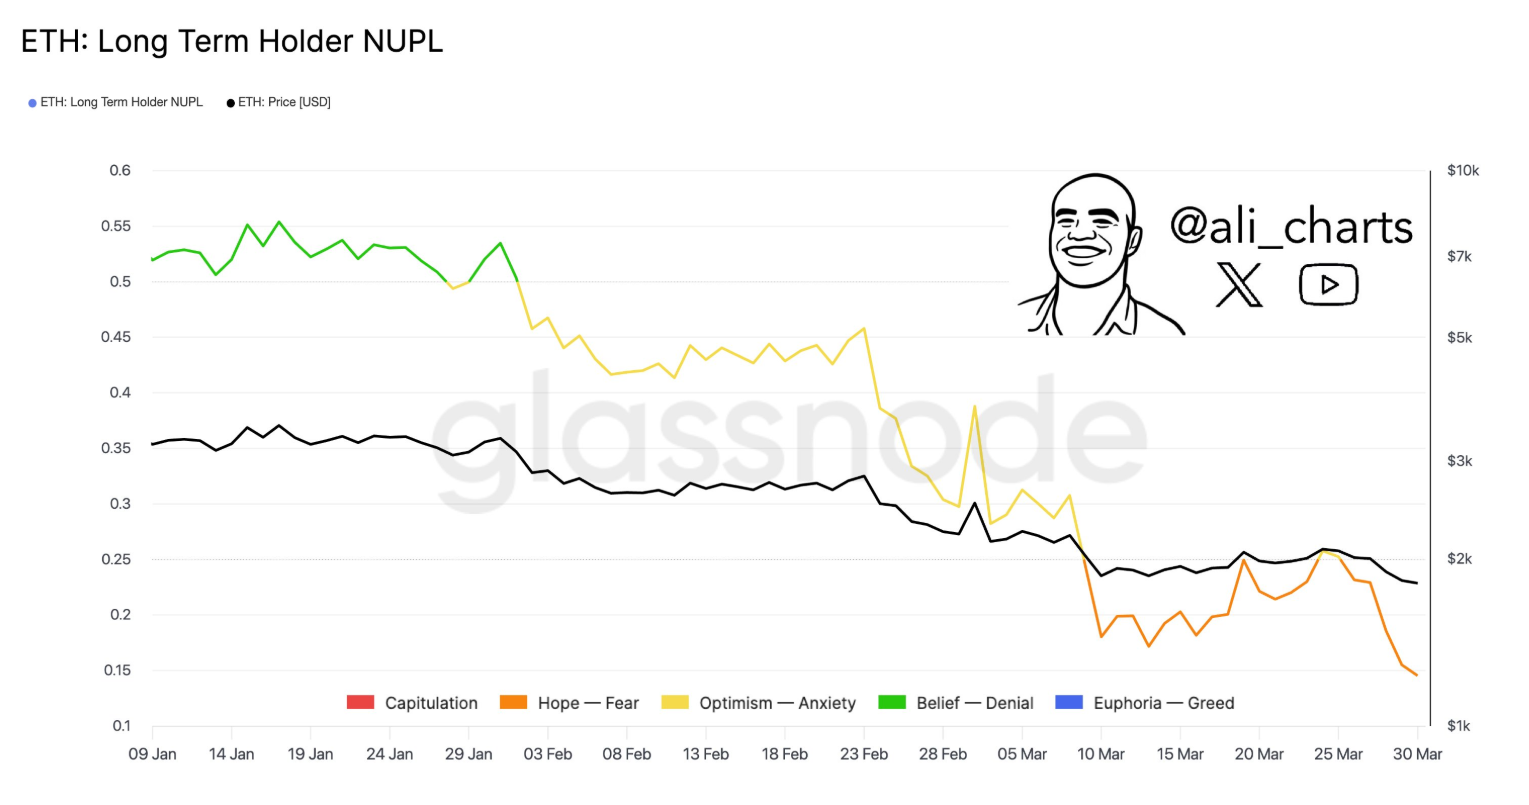
Meanwhile, Ethereum’s price has fallen from around $2,400 in mid February to $1,843 by April 1, according to data from TradingView. The NUPL decline is a result of holders who held the token for a longer period of time losing confidence.
These holders are typically seen as more stable and less reactive, and therefore their current sentiment may be a factor in the behaviour of the broader market.
Moreover, analysis by ali_charts, also shows that fear began to increase from late February when the price dipped below $2,000. The relationship between NUPL values and Ethereum price proves that the market is responding to a prolonged downtrend.
ETF Activity Turns Positive After Weeks of Outflows
Furthermore, ETH ETFs experienced consistent outflows between March 13 and March 28. Total ETF outflows were -73.6K ETH, with major outflows from Blackrock (-15.1K), Fidelity (-12.5K) and Grayscale (-5.2K) on March 13. The same pattern was observed through March 25, with -52.8K ETH on March 18 and -11.7K ETH on March 19.
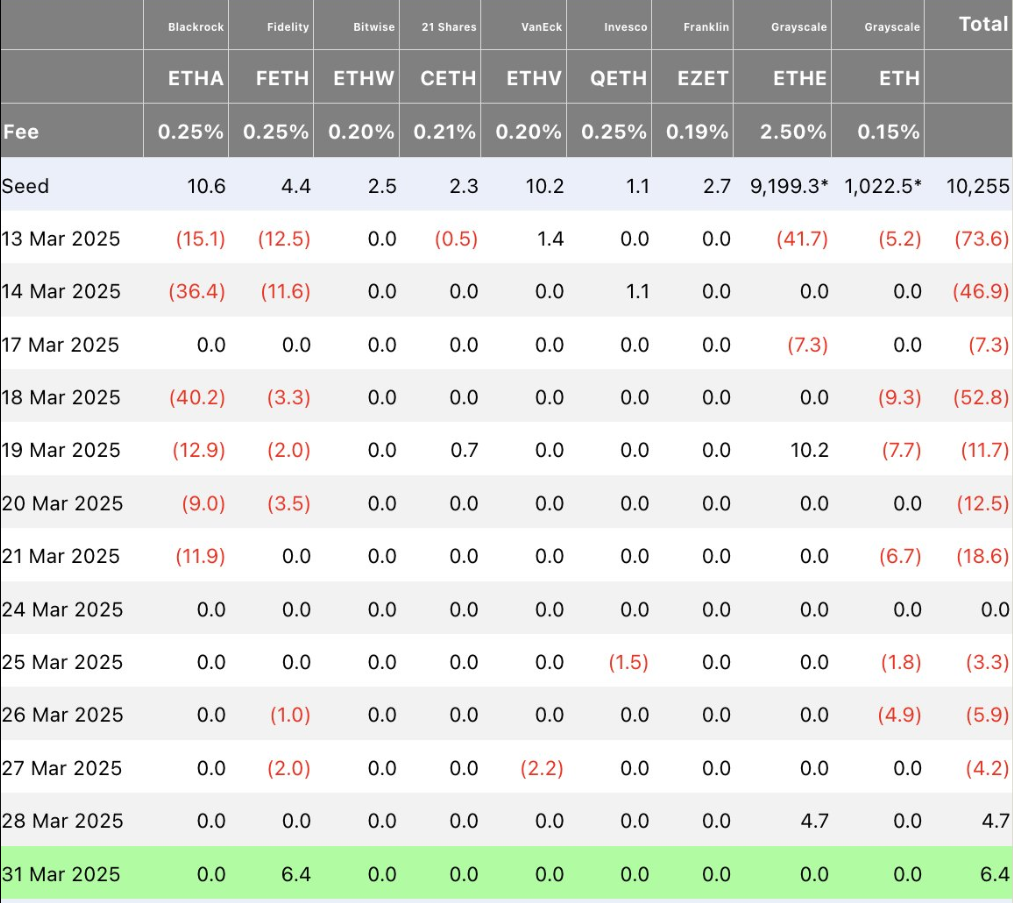
But the trend reversed on March 31 when Ethereum ETFs saw a net inflow of 6,400 ETH. Fidelity’s FETH brought in the largest inflow of 6.4K ETH, which indicates that institutional investors are once again interested.
It was the first positive net flow since two weeks of straight outflows. The figure is modest compared to previous outflows, but it represents a change of sentiment.
Meanwhile, ETH price is trading close to a long-term ascending trendline that goes back to early 2020. This trendline has been a macro support zone for over four years, and the current monthly close at $1,843 is just above it.
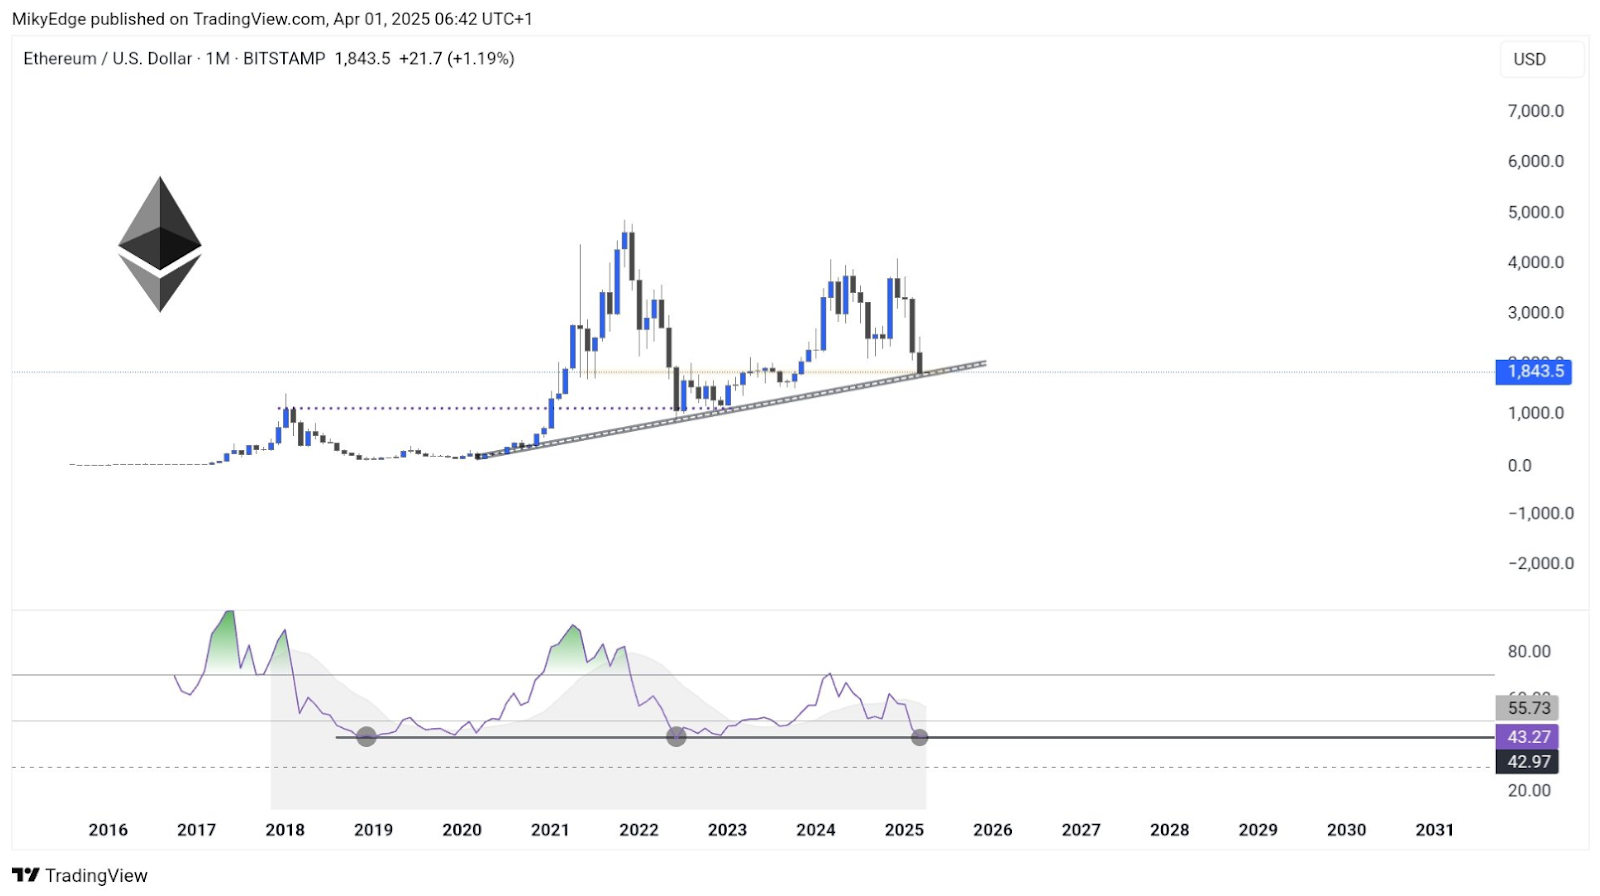
There is also historical RSI levels to support the case for a bounce. Now the monthly RSI is near 43.2, as it was in late 2018 and mid-2022, both times that preceded upward price movements. A break below this trend line could be a sign of more downside for the token.
However, if support holds, a price rebound could occur in the coming months.
Coinbase Staking Raises Questions Over Network Control
As of now, Coinbase is staking 3.84 million ETH through 120,000 validators. This is 11.42% of all staked Ethereum. According to some analysts, such staking activity may be related to ETF providers and the U.S. government.
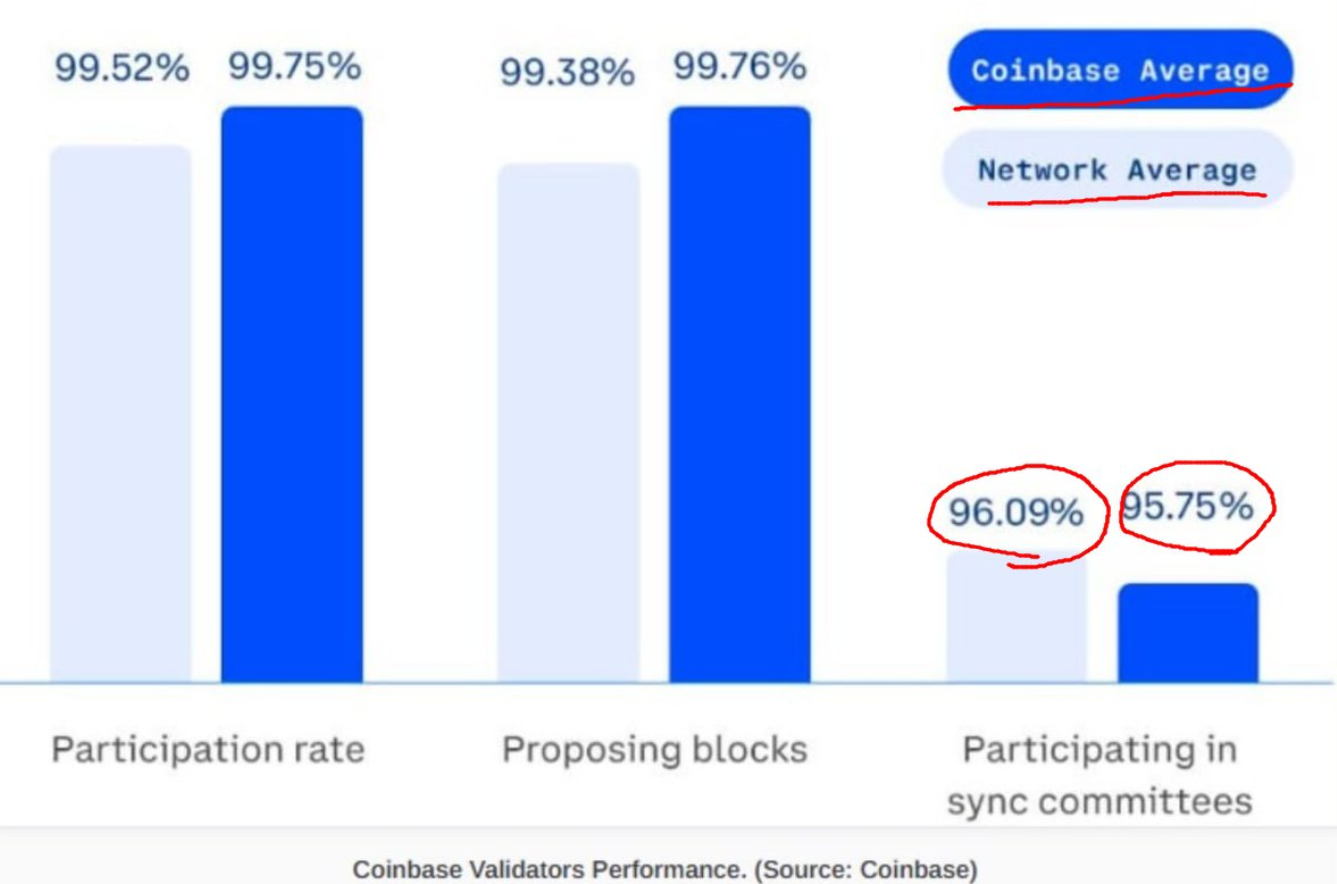
In the short term, the increased staking may limit ETH’s liquid supply and support prices. However, the concentration of staked ETH in one entity could also be a concern, as it could decrease network decentralization.
Even though Ethereum’s network is meant to be decentralized, institutional staking on a large scale shifts this balance. This is seen by some in the community as a short-term price boost, while others are concerned about long-term effects on the network’s design.
Disclaimer
This article is for informational purposes only and provides no financial, investment, or other advice. The author or any people mentioned in this article are not responsible for any financial loss that may occur from investing in or trading. Please do your research before making any financial decisions.