
 streamoors
 IGNITION
 no crying in the casino
 Sword Inu
 Altai the Tiger
 NEAR Protocol
 Quantus
Key Insights:
- SOL/BTC continues its fall, tracking ETH’s path with no strong recovery call.
- Key liquidation zone at $153.50 may pull price lower in coming sessions.
- Weekly trend signals show repeated shorts, keeping Solana‘s outlook bearish.
The week ended with Solana looking like it was under pressure, with price action showing a textbook head-and-shoulders pattern on the 4-hour chart.
The neckline is close to $166.00 and a decisive break and retest below it could signal further decline, with the next major support zone at $146.67.
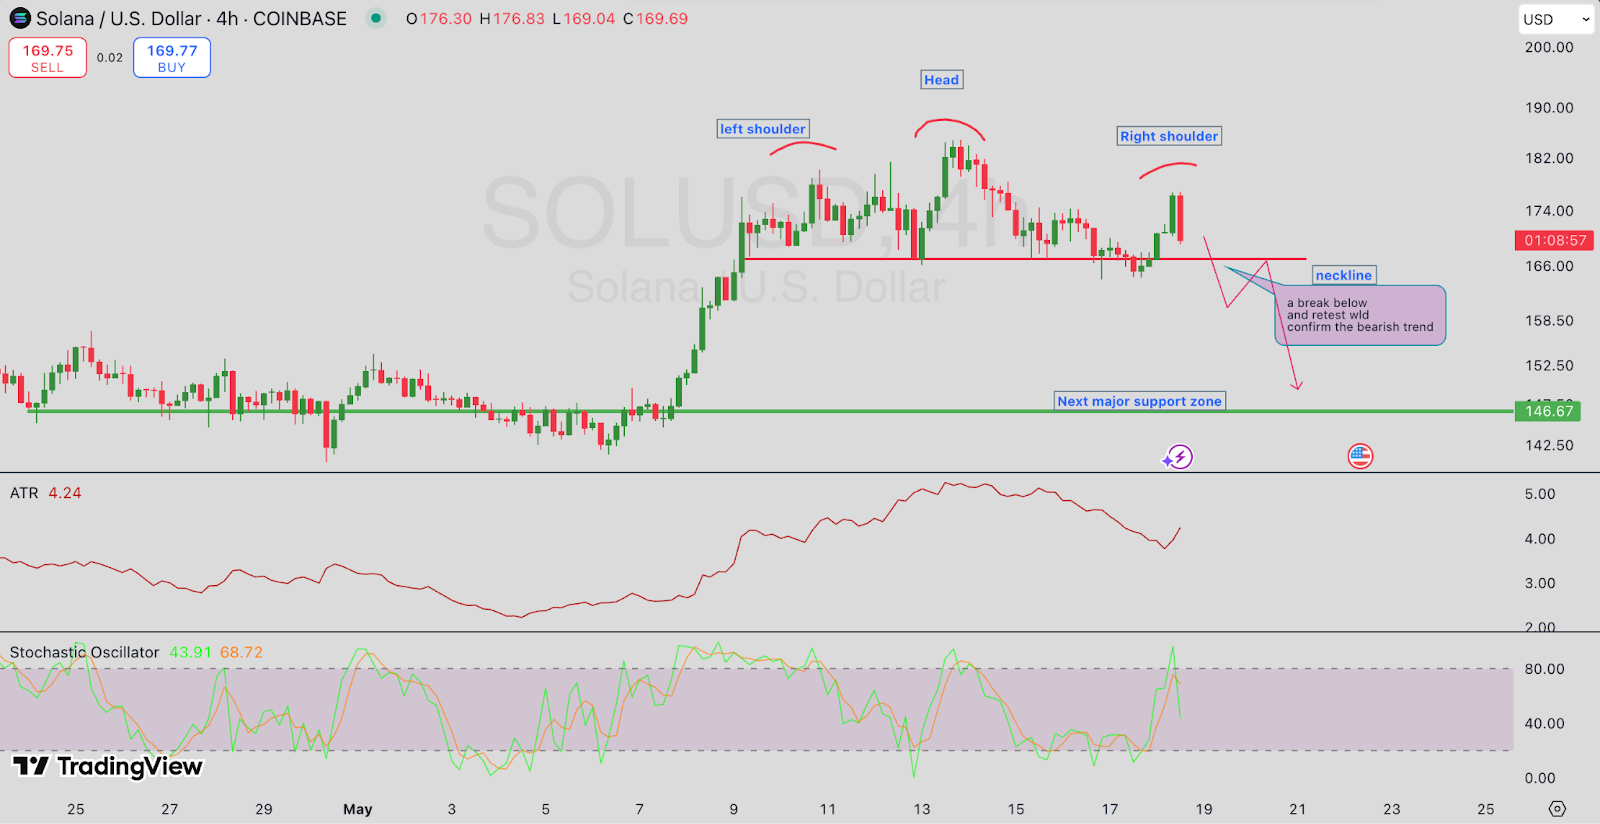
This technical pattern is added to by the Stochastic Oscillator, which is cooling momentum. The orange line is at 68.72 and the green line sits at 43.91, which indicates bearish divergence.
Also, the current Average True Range (ATR) is 4.24, which suggests that the stock is likely to be volatile in the near future. This cautious tone is supported by Solana’s derivatives data on Coinglass.
Total trade volume rose +2.05% to $10.11 billion, while open interest fell -1.28% to $6.65 billion. That means some traders are closing out positions instead of opening new ones.
Meanwhile, the long/short ratio on Binance accounts is 2.0386, while the 24-hour ratio for trades is 0.9704. This means that even though more accounts are long, the trade activity is evenly split. It appears that short-term traders are hedging more actively, waiting for clearer direction.
The price could be pulled lower by key liquidation levels
Additionally, Coinglass’ liquidation heatmap shows clusters of important liquidity that could serve as price magnets. Also worth noting is a big cluster at $153.50 where $44.32 million in leverage positions could be liquidated if price falls to that level.
The next big liquidity band is between $140 and $146 which coincides with the earlier mentioned support zone on the chart.
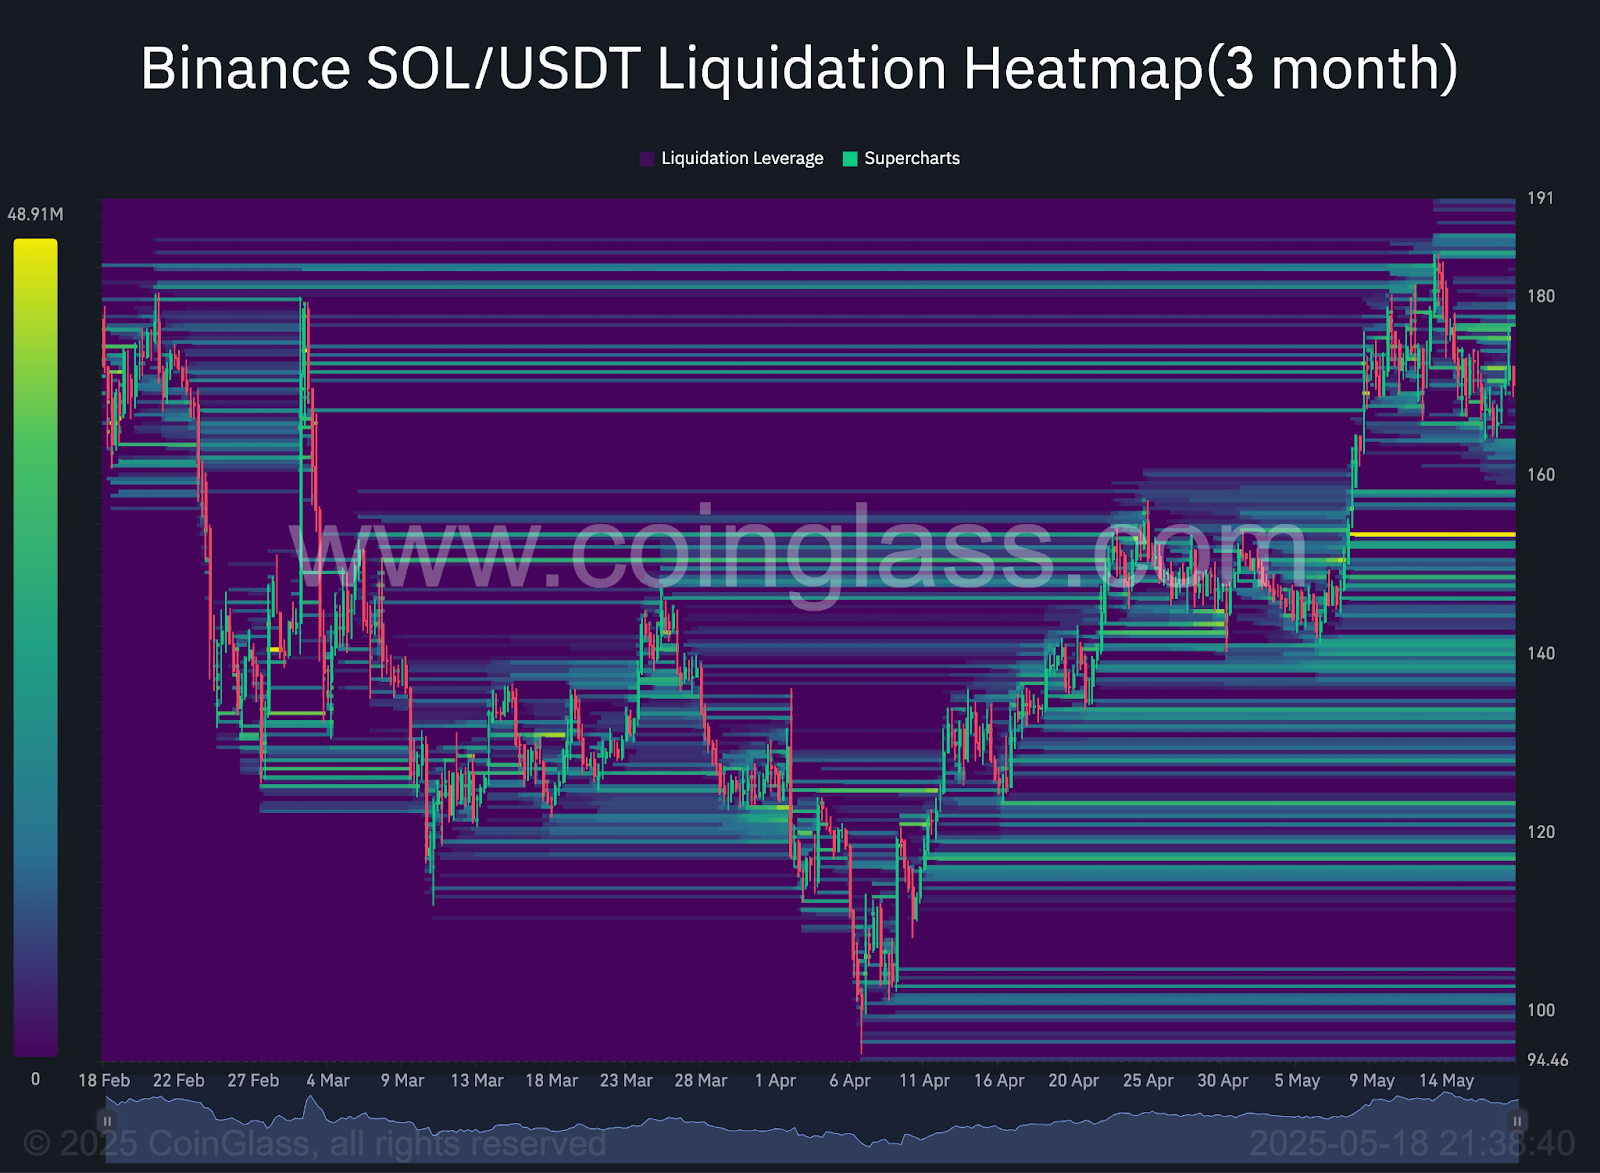
Market makers and institutional traders can push prices towards those levels when leveraged positions build up at certain prices, in order to trigger liquidations. When sentiment goes bearish, this mechanism puts pressure on price.
The path beneath is still crowded with risk, as the visible clusters in the heatmap are stacked liquidation lines all the way down to $120.
SOL/BTC Shows Further Weakness, Mirroring Historical Patterns
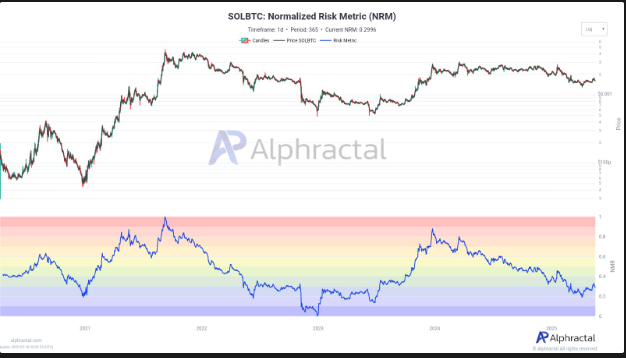
On the other hand, the SOL/BTC pair appears weak on many metrics, suggesting that Solana may be underperforming Bitcoin in the near term. The current value of the Alphractal Normalized Risk Metric (NRM) is 0.2996.
This puts Solana in a low risk, low reward zone, something that is often seen at the end of an accumulation or start of a further markdown phase. Similar readings in the past have been followed by price declines over the next 30 to 60 days.
The risk-adjusted returns as measured by the Sharpe Ratio is also in a downtrend. Since early 2025, it has fallen below zero several times and remains below neutral territory.
A deeper correction usually follows when the Sharpe Ratio is below -0.8, as happened several times in late 2022 and early 2023. The low risk-adjusted returns indicate that SOL isn’t beating on a volatility-adjusted basis.
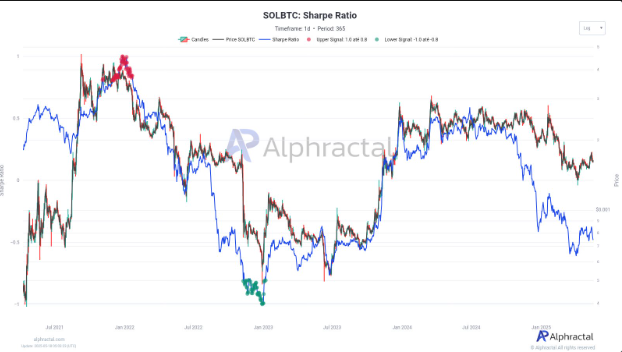
It seems that the distribution patterns we saw earlier in February are repeating themselves. SOL/BTC mimics ETH/BTC in previous cycles where any minor pullback in BTC leads to a disproportionately large drawdown in SOL.
Solana has underperformed and unless BTC itself corrects broadly, we could see smaller altcoins continue to underperform.
Long-Term Trend Remains Bearish on Weekly Signals
On the weekly SOL/BTC chart, Alphractal’s ATR-VWMA trend signal is also bearish. Since the start of 2025, multiple short signals have been seen, and the price is below the VWMA line.
The last confirmed “Short” signal was on a failed rally attempt near late March 2025. From there, price has not been able to reclaim upward momentum, trading below both the VWMA and ATR breakout bands.
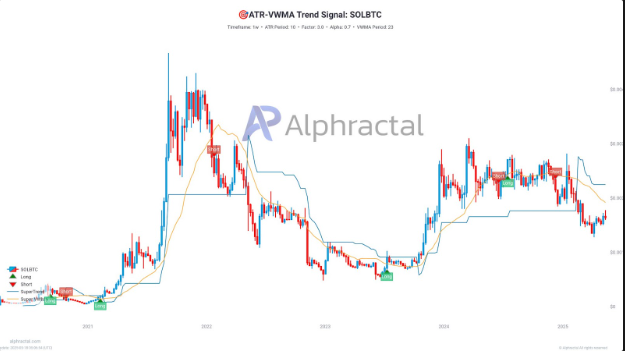
The broader trend weakness is visible as lower highs and lower lows in the weekly candle structure. The trend bias will be downward unless the price breaks above key resistance near the VWMA band.
One long signal was printed in mid-2024, but it did not hold, illustrating that current market conditions still favor the downside.
SOL/BTC is likely to remain under pressure until broader crypto market conditions change or BTC pauses its dominance cycle. If volatility of BTC rises, the next 45 days are likely to be crucial.
Disclaimer
This article is for informational purposes only and provides no financial, investment, or other advice. The author or any people mentioned in this article are not responsible for any financial loss that may occur from investing in or trading. Please do your research before making any financial decisions.




