streamoors
 IGNITION
 Celestia
 Injective
 Starknet
 Pearl
Pearl Quantus

Key Insights:
- Over 7,000 BTC withdrawn from Binance since June 6, suggesting early positioning and reduced exchange sell pressure.
- Mid-tier addresses holding 100–1,000 BTC are steadily accumulating while whales continue offloading since mid-2024.
- Bitcoin futures show signs of short-term correction as long interest falls and shorts build beneath $108K resistance.
Bitcoin’s mid-year on-chain trends for 2025 revealed a reshuffling of accumulation behavior. Major whales exited the market, while mid-tier holders increased exposure and began shifting assets to cold storage.
Whale addresses offloaded over 546,000 BTC since July 2024. In contrast, addresses holding between 100 and 1,000 BTC actively withdrew funds from exchanges and added to their holdings.
Exchange Outflows Show Reduced Sell Pressure
Since June 6, over 7,000 BTC exited Binance, a move that reflected deliberate cold storage allocation by larger players.
The net outflows pointed to reduced near-term sell pressure. Historically, such trends coincided with tighter supply and price stability. Fewer exchange balances indicated that long-term investors maintained confidence in holding.
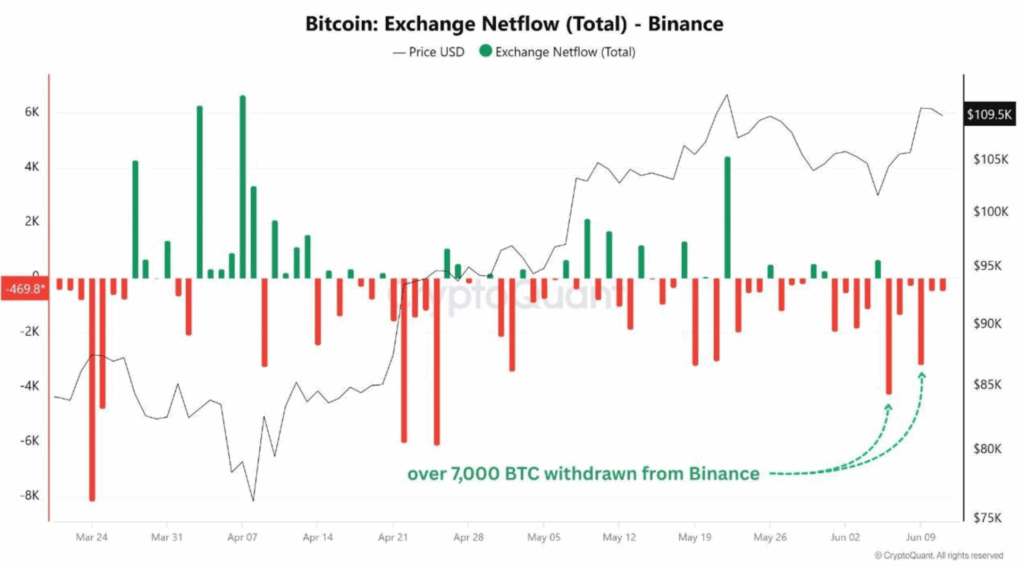
High liquidation volumes and overall volatility have seen BTC price trade around the $105K. This is a sign of continued absorption of selling activity and backing by market participants withdrawing money off exchanges.
Stability at local highs with big outflows can be an early-stage setup to bullish continuation.
Such outflows do not seem random and occur in a systematic manner, probably as a result of institutional cold wallet relocation. Such patterns have historically been followed by significant upside moves as liquidity becomes tight with a new demand.
Mid-Tier Addresses Dominate 2025 Accumulation
Additionally, on-chain cohort analysis depicts a robust accumulation in the addresses ranging between 100 and 1,000 BTC. The cohort, dubbed as dolphins, has demonstrated resilient inflows throughout the year 2025, despite other groups decreasing exposure.
The heatmap data supports the claim that it is the only segment exhibiting the accumulation behavior at the moment.
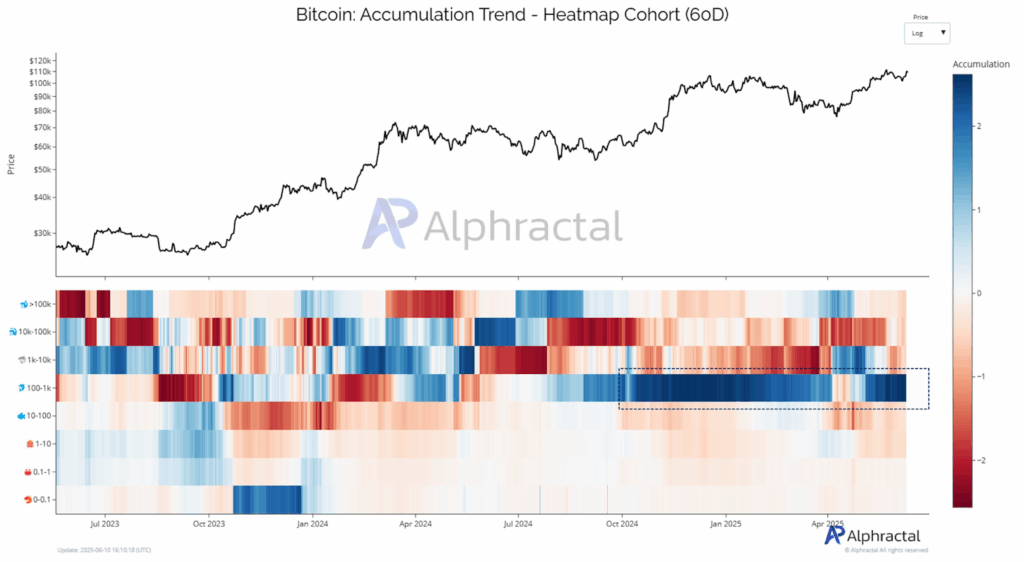
However, addresses holding over 1,000 BTC have been distributing over 546,000 BTC since mid-2024, which decreased their aggregate circulation supply share considerably.
This decline in whales is part of a multi-year trend that started with the massive BTC purchase by Tesla in 2021. It is a question of whether these whale addresses still belong to large exchanges or whether real holders are leaving positions.
The supply trend chart lends credence to this, with the collective balance of 100–1,000 BTC addresses increasing over time and balances of >1,000 BTC balances stagnating or decreasing.
The shift in the balance structure implies the redistribution of coins on the market, which can influence the formation of future rallies. When accompanied by low supply on the exchanges, strong mid-tier accumulation is likely to act as price support.
Derivatives Data Shows Mixed Sentiment and Caution
As spot accumulation continues to be bullish, derivatives are becoming cautious. The Bitcoin futures data shows declining open interest and the accumulation of short positions beneath the $108K resistance.
It is a common indicator of a short-term indecision and it points to the possibility of a near-term price consolidation.
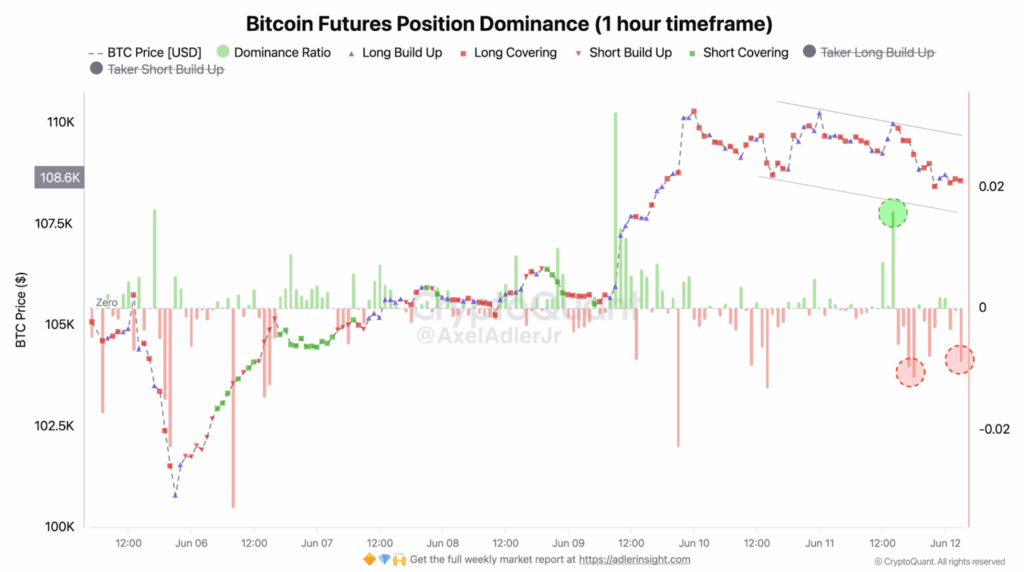
Funding rates are positive, but prolonged liquidation processes have been common in the past few days. That suggests profit-taking or defensive repositioning as opposed to aggressive directional conviction.
When long interest declines and funding is still high, the price tends to range until new catalysts develop.
Charts indicate that there were short-lived green spikes in the dominance ratio, but they quickly turned down, validating the loss of bullish momentum.
Late short build-up bars and long covering indicate that market participants are taking off leveraged positions ahead of rising volatility.
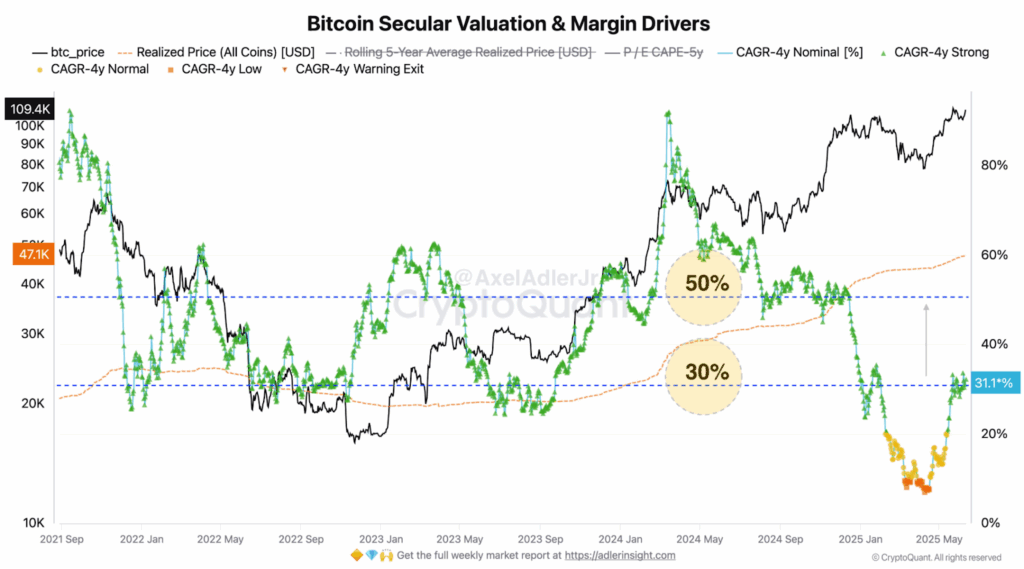
Nevertheless, the larger technicality remains bullish. Bitcoin CAGR (Compound Annual Growth Rate) has recovered to 31% after plunging to 7% in April, despite short-term positioning changes.
This rebound confirms the opinion that structural demand is coming back. The price models show there is a potential route to reach $168K in Q4 provided the same momentum is maintained.
Disclaimer
This article is for informational purposes only and provides no financial, investment, or other advice. The author or any people mentioned in this article are not responsible for any financial loss that may occur from investing in or trading. Please do your research before making any financial decisions.