astronaut
 Zylo Ecosystem
 Pearl
Pearl Bitcoin
 Quantus
 Pudgy Penguins
 Bitway
Key Insights:
- XLM has formed a bullish flag pattern, and experts suggest a potential 75% rally in the coming days.
- $4 million worth of XLM leaves the exchanges, suggesting ongoing accumulation.
- The technical indicator Supertrend flashes a bullish signal for XLM, also hinting at the bulls’ domination.
With a 4% price dip, XLM crypto marked its second consecutive day of loss after registering a 17% gain in recent days. Despite the price correction, crypto experts have shown a strong interest in the token, which suggests a strong price recovery ahead.
XLM Crypto Price Action and Expert Bold Prediction
A prominent crypto expert recently shared a post on X (Previously Twitter), boldly predicting that XLM could soar by 75% and reach the $0.70 level. The expert’s forecast comes after the asset has formed a bullish flag pattern in the daily timeframe.
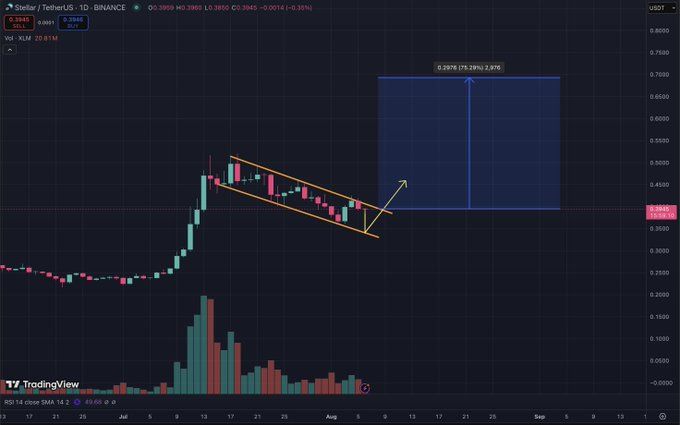
According to TradingView’s daily chart, XLM crypto appears bullish as it has formed a flag and pole pattern, and the price is on the verge of a breakout. At press time, the asset is experiencing resistance at the upper boundary of the bullish flag.
XLM Price Prediction and Technical Analysis
Based on the recent price action, a strong upside momentum could be possible if the momentum returns and XLM ends its bearish streak by breaking out of this bullish pattern.
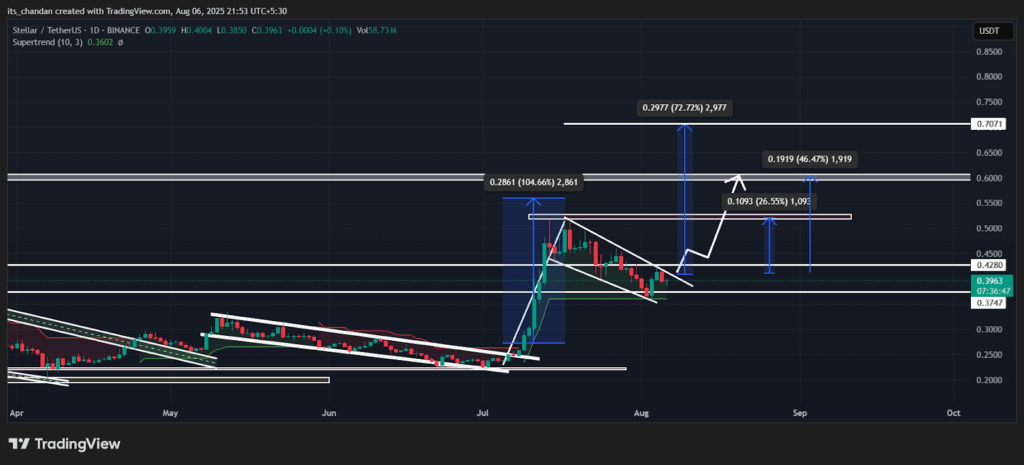
If this happens, the asset could soar by 27% and reach the $0.53 level. Meanwhile, if this momentum continues, it can rise by 45% and 70% to the $0.605 and $0.70 levels, respectively, in the future.
This bullish price action is supported by a bullish technical indicator, Supertrend, which is in green and positioned below the XLM crypto. This indicates that the asset is in an uptrend, with bulls dominating and strong buying pressure present.
At press, the XLM crypto stands at 0.3913 and has slipped 4% over the past 24 hours. During this period, the asset showed an impressive price recovery, climbing from $0.3855 to $0.3913.
Despite the ongoing price recovery, investors and traders’ participation decreased compared to the previous day. CoinMarketCap data reveals that XLM Crypto trading volume has sunk by 30% during this period.
The potential reasons behind this lowered participation are unclear price action and the bullish breakout, which has yet to occur.
On-Chain Metrics Indicate Bullish Sentiment
Despite lower participation, traders and investors’ sentiments turn bullish as they look at the bullish side.
The on-chain analytics tool Coinglass reveals that traders have found strong standing along with the long positions. According to on-chain data, in the XLM crypto, the major liquidation level that traders have eyes on is $0.3782 on the lower side and $0.3997 on the upper side.
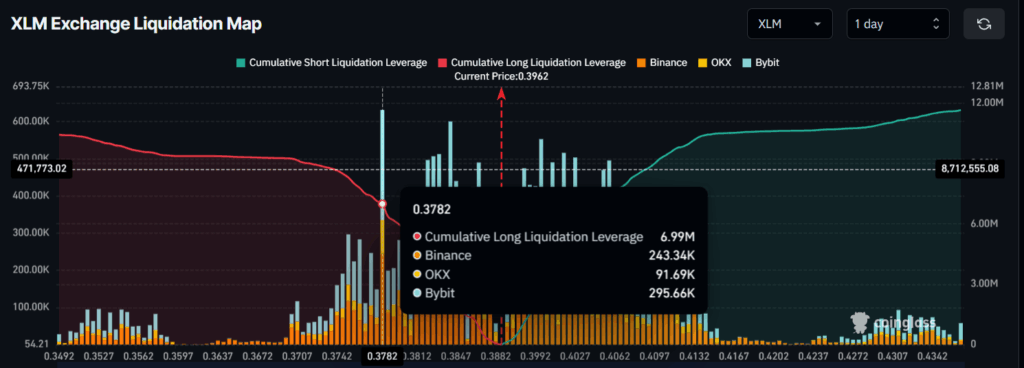
At this level, traders have built over $6.99 million worth of long and $2.50 million worth of short positions. This has made it clear that intraday, despite the price dip, traders have a strong positive belief.
Not just traders, investors, and long-term holders, but also appear to be accumulating tokens. Spot inflow/outflow data reveals that exchanges have recorded an outflow of $4 million worth of XLM over the past 48 hours. This substantial outflow suggests potential accumulation and a strong recovery for the asset.
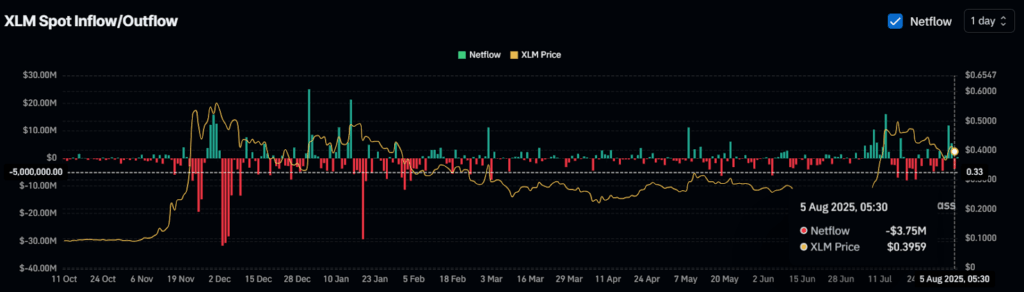
When combining these metrics with the technical analysis, it appears that the bulls are back and dominating the asset, as it is forming a bullish pattern.
Disclaimer
This article is for informational purposes only and provides no financial, investment, or other advice. The author or any people mentioned in this article are not responsible for any financial loss that may occur from investing in or trading. Please do your research before making any financial decisions.