streamoors
 IGNITION
 no crying in the casino
 Sword Inu
 Altai the Tiger
 NEAR Protocol
 Quantus

MSTR stock price outlook darkened this week as it continued its strong downtrend. Strategy share price plunged to a multi-month low of $326, down by over 26% from its highest level this year. This article provide a forecast for the stock as the net asset value (NAV) multiple plunges.
Strategy NAV Multiple Has Plunged
The NAV multiple is a crucial valuation that analysts watch when valuing Bitcoin treasury companies and investment funds. In Strategy’s case, the multiple is calculated by dividing the market capitalization with its Bitcoin holdings.
In this case, Strateg holds 629,376 Bitcoins valued at over $71 billion now that Bitcoin is trading at $114,000. Its market capitalization is $98 billion, which explains why the NAV multiple has moved to 1.31.
The NAV simply measures the gap between the company’s valuation with its Bitcoin holdings. It is now worth about $27 billion, which is the gap between its market cap and the BTC holdings.
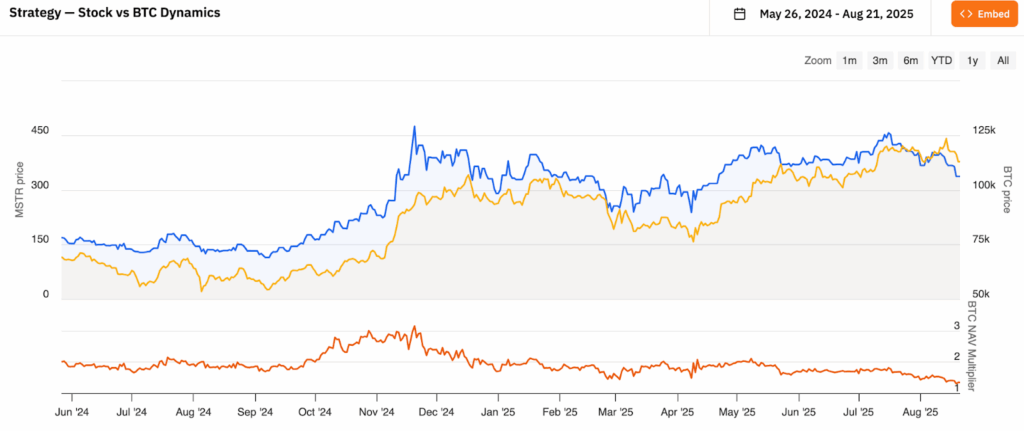
The 1.37 ratio means that MicroStrategy is highly overvalued because of the gap between the two. On the positive side, the ratio has been in a downward trend as the chart below shows. It has moved from 3.1 in November last year to 1.7 today.
Short-Term Volatility But Long-Term Gains Possible
The future of the MSTR stock price will be based on Bitcoin price performance. If Bitcoin continues its strong rally, its holdings will become more valuable.
The challenge is that there are odds that Bitcoin price will face major headwinds. The weekly chart below shows that the BTC price has been in a strong bull run in the past few years, jumping from $15,460 in December 2022 to an all-time high of $124,200.
Trend indicators like moving averages and the Supertrend show that the coin has more upside. However, oscillators like the Momentum and the MACD indicators have formed a bearish divergence patten.
The momentum oscillator has moved downwards, while the Percentage Price Oscillator (PPO) has also dropped in the past few months.
Most notably, the BTC price has formed a rising wedge pattern that is shown in green. This pattern is made up of two uptrending and converging lines.
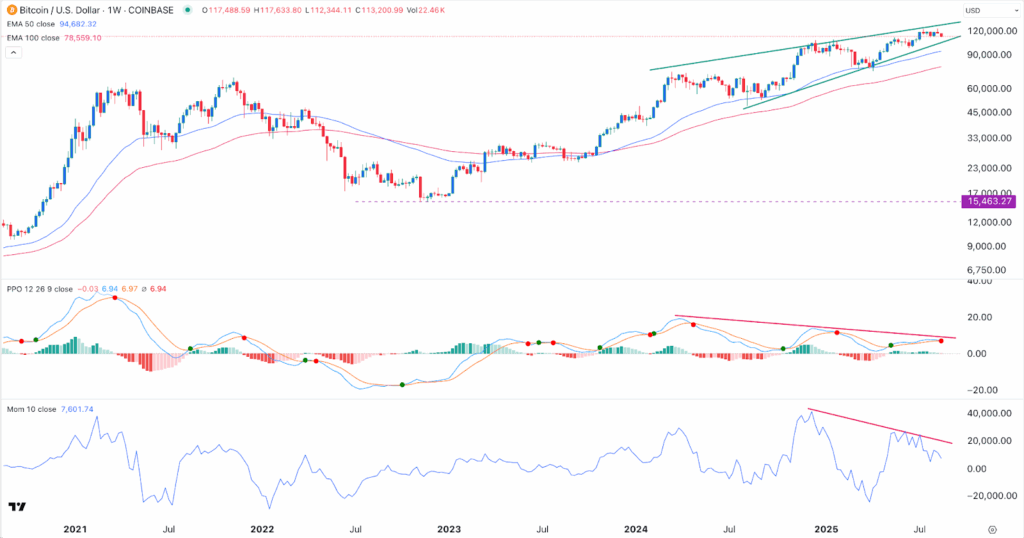
With their convergence nearing, there is a likelihood that the coin will crash, potentially below the support at $100,000 in the next few week. Such a move will then lead to more MSTR stock price dip.
MSTR Stock Price to Drop Before Rebounding
The bearish Bitcoin price outlook is happening at a time when MSTR stock has also formed bearish signs on the daily chart.
This chart shows that it has formed a double-top pattern at $427 and a neckline at $360. This pattern often leads to more downsides as it signals that bulls are afraid of buying.
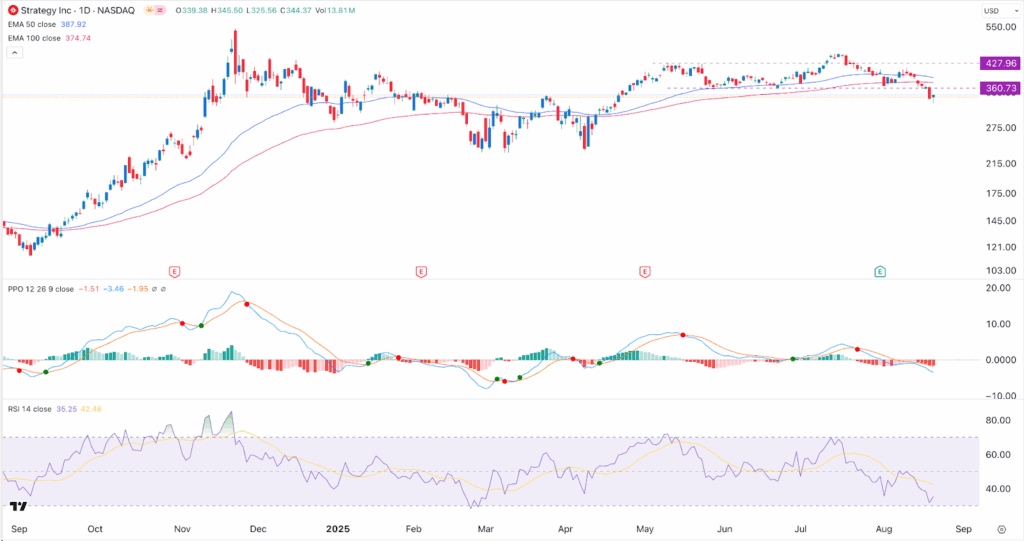
MSTR share price has moved below the 50-day and 100-day Exponential Moving Averages (EMA), confirming the bearish breakout. Like Bitcoin on the weekly chart, MSTR’s MACD and the RSI have also fallen. Therefore, the stock will likely continue falling as sellers target the support at $300.
Verdict: Is the Strategy Stock a Good Buy Today?
MSTR stock price has surged since it started accumulating Bitcoin a few years ago. The ongoing divergence with Bitcoin started last year as more Bitcoin treasury companies launched.
The most likely scenario is where the MSTR share price will continue falling in the near term as odds of Bitcoin plunging rises.
In the long-term, however, there are chances that the stock will bounce back as Bitcoin recovers. Historically, Bitcoin has always bounced after falling.
For example, BTC rose to $111,883 in May and then pulled back by 15% and then rebounded to a record high two months later. The same trajectory may happen in the coming weeks.