
 Pearl
Pearl Bitway
 Zcash
Zcash Walrus
 Aerodrome Finance
 Starknet
 NEAR Protocol

The Altcoin Season Index has jumped to 80, its highest point since 2021. Meanwhile, the market dominance chart for Bitcoin has developed a death cross.
The pattern has only happened two times in the last ten years. These indicators, combined, demonstrate a significant change in the power of the market towards altcoins.
Bitcoin Dominance Falls to Multi-Year Support
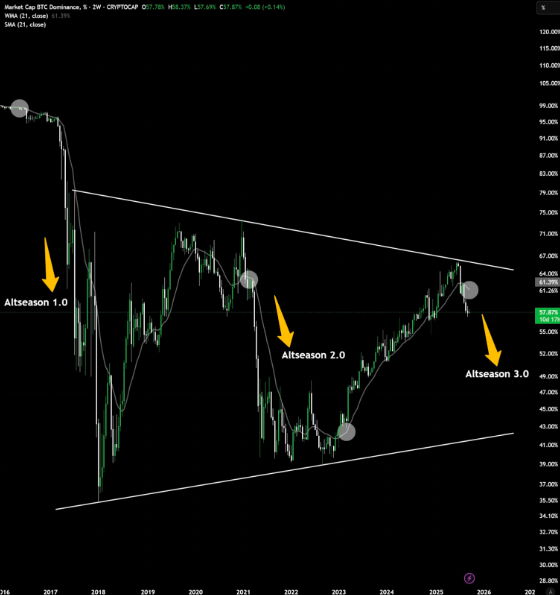
The charts indicate that since 2017, Bitcoin dominance has exhibited a long-term descending triangle pattern. This structure has already created two large points of breakdown. As the Altcoin season 3.0 arrives, Bitcoin’s dominance has fallen to approximately 57.87.
The 21-week simple moving average has crossed the weighted 41-week moving average to form the death cross. The same trend was observed in late 2016 and early 2021, before altcoins experienced a significant market share. This technical structure is now repeating.
The Altcoin Season Index surged from the mid-30s in May 2025 to over 75 by September. It reached a peak of 80, signaling strong momentum in alternative cryptocurrencies.
It is one of the largest capital rotations into altcoins since the market cycle 2021. In past peaks, the high readings were accompanied by prolonged dominance of the altcoins over Bitcoin. This is particularly true when the bull markets were at their peak.
Ethereum’s Role in Leading the Rotation
Ethereum is one of the drivers of this change. Ethereum is the largest altcoin in terms of market capitalization. It is the gateway for institutional and retail liquidity into the crypto ecosystem.
It powers smart contracts, decentralized finance, and stablecoins. It’s also the foundation for many Layer-2 networks. A rising ETH/BTC ratio typically signals capital moving away from Bitcoin. It often flows into Ethereum and other altcoins instead.
This is recurring because ETH/BTC is regaining ground after recent lows. This proves that a change in liquidity is taking place. The two earlier death cross events on the Bitcoin dominance chart were milestones.
In late 2016, Bitcoin held over 85% of the crypto market share. By mid-2017, its dominance dropped below 40%. Ethereum, Ripple, and other early altcoins gained significant ground during this period.
A similar trend occurred in early 2021, immediately ahead of explosive rallies in decentralized finance tokens, NFTs, and Layer-1 competitors.
The third such event is the current cross coming in as the Altcoin season Index is struggling to hit a four-year high. Technical and market signals are aligning. This suggests a shift in capital flow direction is underway.
Are we Assured of an Altcoin Season?
During top periods, altcoin seasons usually come in multiple waves, from a few weeks to a few months. The historic averages indicate the highest altcoin cycles have a 17-30 day average. After that, the capital usually shifts back to Bitcoin, and then the cycle continues.
Such a direction of rotation is observed in the charts, as the trend of dominance of Bitcoin is moving down. Also, the Altseason Index is moving up. Together, the signals point to a data-driven shift in the crypto market.
Traders and investors are rapidly pulling out of Bitcoin resources. This mirrors past exits from other major market cycles. The 57.87% on Bitcoin’s dominance is far lower than 64 percent earlier this year. The Altcoin season Index at 80 is five full points beyond the mark officially taken as an altcoin season.
The falling triangle on the dominance chart of Bitcoin has created back-to-back lower highs every 71, 67, and 64. This highlights a broader tendency for Bitcoin shares to decline compared to altcoins.
Death crosses in 2016 and 2021 marked key turning points in crypto history. A sustained boom followed each in altcoins.


