Quack AI
 NEAR Protocol
 Quant
Quant Ondo
Ondo Zcash
Zcash Pearl
Pearl Sui
Sui
Nvidia stock price continues its strong bullish momentum this week and hit its all-time high. It moved out of its recent consolidation and hit a record high of $190, up by over 120% from its lowest level this year.
NVDA stock has strong catalysts lined up for Q4. These could boost its market capitalisation from $4.5 trillion to over $5 trillion.
Nvidia Stock to Rally After Major Developments on AI
Nvidia, the world’s largest graphics processing unit (GPU) manufacturer, came under pressure between July and September. During this period, the Nvidia stock remained within a narrow range between $184 and the support level at $163.
Nvidia wavered as investors reacted to several bad news about the company and the AI industry. One setback was the Trump administration’s decision to impose a ban. It restricted the company and AMD from selling chips to the Chinese market.
Another notable bad news was that the Chinese government launched an investigation into the company. Ultimately, officials urged companies not to use their products in favor of local chips.
Additionally, there were signs of competition in the AI sector as OpenAI partnered with Broadcom for custom AI chips. Still, there are some signs that Nvidia has more growth ahead.
One of the top signs is a report released this week by Citi analysts. They predicted that the big tech companies will spend $2.8 Trillion on AI by 2029.
If this is accurate, it will be a significant benefit for NVDA stock. In addition to this, Nvidia has solidified its moat by developing CUDA. It’s a software that enables the transition of GPUs for general-purpose use.
Data Center Spending Accelerating
Another important catalyst for the Nvidia stock price is the indication of robust spending in the data center space. One sign of market momentum is a report involving GIP, owned by BlackRock.
The firm was considering a $40 billion bid for Aligned Data Centres, a U.S.-based data centre operator. If confirmed, the acquisition would signal bullish sentiment from corporate investors. This comes despite ongoing concerns that the AI sector may be in a bubble.
Meanwhile, Nvidia has entered into a deal with OpenAI, estimated to be worth over $100 Billion. This deal will facilitate the construction of additional data centers in the United States and other countries.
Another notable deal came from Meta Platforms, which inked a $17 Billion deal with CoreWeave. This deal will see Facebook’s parent company increase its buy of computing space from the company.
It mirrors other deals, such as OpenAI’s deal with CoreWeave and Microsoft’s partnership with Nebius.
NVDA Stock Seems Undervalued
A closer look at Nvidia’s $4.5 Trillion valuation shows that it is not as overvalued as some investors believe. Seeking Alpha data shows that NVDA stock has a forward P/E ratio of 42. Its non-GAAP multiple stands at 41, reflecting strong valuation metrics.
While these numbers are higher than the S&P 500’s 22, they are much lower than its historical figures. The five-year PE average for the company is 59 on a GAAP basis and 47 on a non-GAAP basis.
Additionally, the company has a forward price-to-earnings-to-growth multiple of 1.1. It is lower than the sector median of 1.18.
Nvidia Stock Price Technical Analysis Points to More Gains
The daily timeframe chart indicates that the Nvidia stock price has more upside potential in the coming weeks. It could reach $205 and beyond. A move to that level will mean that it has become the first company to attain a $5 Trillion market capitalization.
The chart shows a move above the key resistance level at $184. This level marks the neckline of a small inverse head-and-shoulders pattern. It is also a level that has resisted movement above several times.
NVDA stock price has remained above the 50-day moving average. At the same time, the Relative Strength Index (RSI) has been trending upwards and is nearing the overbought level.
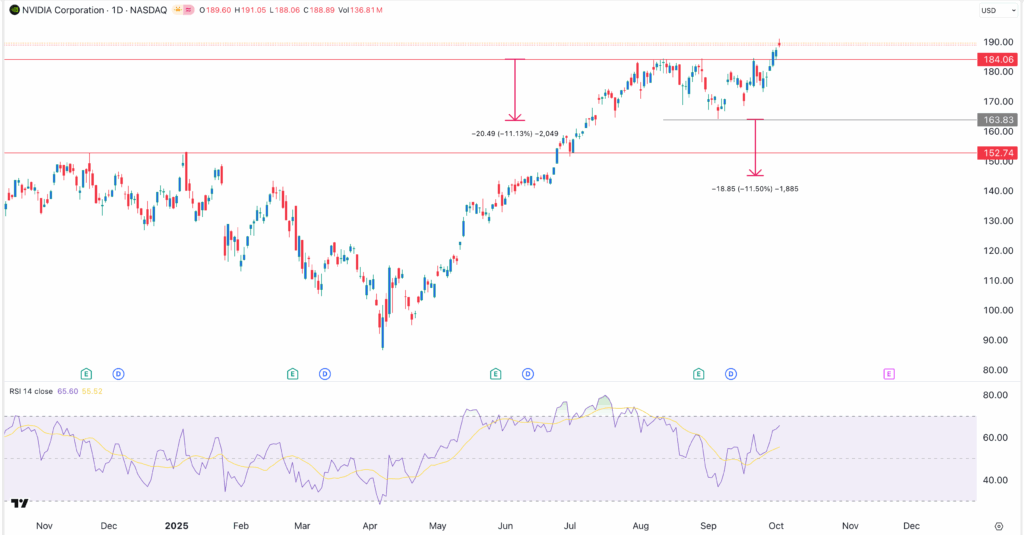
The most likely scenario is continued upward movement. This trend is likely to persist in the coming weeks. Investors are watching closely for the next earnings report.