
 Puffer
 Bitcoin
 ZKsync
 NEAR Protocol
 Walrus
 Pearl
Pearl Ondo
Ondo

Solana price formed a support at a key level, indicating high market resilience. Several analysts speculate that the current range is a new higher low. Meanwhile, with some increasing confluence near $189-$186, projections are now pointing to a potential bullish run-up towards $220.
Solana Price Structure Matches Bullish Recovery Setup
SOL price continues to show a classic bullish market structure of higher highs and higher lows. CryptosBatman highlighted this on his one-hour chart.
He also pointed out the existence of a fair value gap (FVG) between $188 and $190. He explained that this FVG could become the next accumulation zone where buyers return to the market.
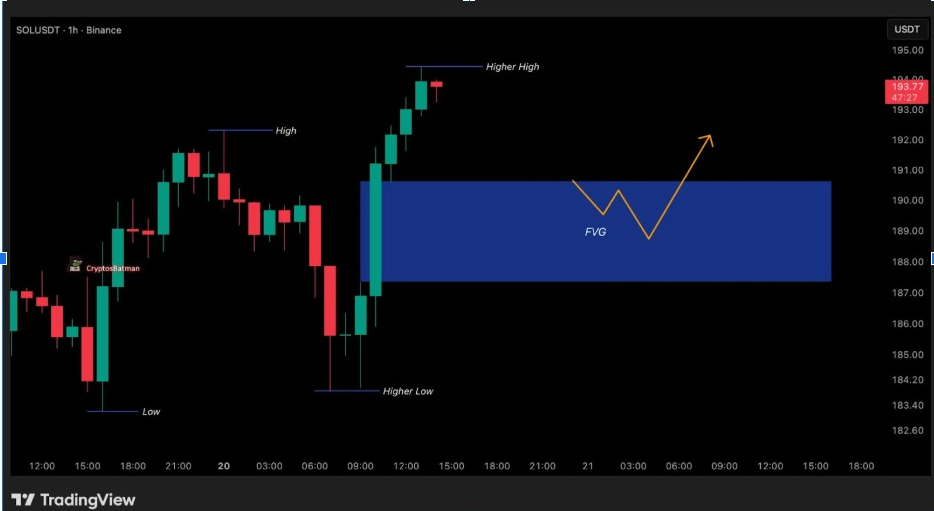
He stressed that keeping up structural integrity is key to sustaining momentum. A retracement into the FVG zone could form a higher low, driving the uptrend base stronger. The pattern reflected the textbook price trend in consolidation phases prior to continuation.
Once liquidity stabilizes in this zone, the Solana price could rise above $195. It may also approach the $200 resistance level in the short term. For CryptosBatman, $189 is still the crucial area where bulls need to defend to confirm structure continuity.
Sheldon’s Outlook: Solana Price Poised for a Bullish Breakout
Sheldon The Sniper provided a wider view of the SOL price potential path to $220. His eight-hour chart showed a retracement phase within the Fibonacci range between 0.382 ($186.54) and 0.618 ($181.73).
He expects that the Solana price will dip into this zone before buyers take control back. This move would create another higher low. It’s a signal often preceding a great bullish continuation.
According to Sheldon, it’s important to maintain composure during retracement. He reminded traders that higher timeframe structures take time to develop. His projection is a temporary pullback back into the mid $180s, with an impulsive breakout to $220.
Fragile Base Amid Bullish Prospects
More Crypto Online offered a cautious, but optimistic view. He identified micro support for SOL price at around $186.38. He suggested that holding this level could secure short-term bullish momentum.
His Elliott Wave count showed a possible 1-2 pattern forming within a wave C structure. If validated, the next impulsive wave is the next bull trap that can take the Solana price to $208-$212 in the short term.
However, he also recognized a weak base under this rally. The recent upward moves, while promising, are still based on limited momentum. A drop below $186 could lead to a deeper drop and call the wave structure into question.
The analyst insisted that this level can and should still be a line of defense for bullish traders. Sustained consolidation above support would improve the probability of a rally towards $220.
Strength at Macro Support
Donald Dean added a volume-based analysis, reinforcing the broader bullish picture. His chart showed multiple “volume shelves,” important areas where traders have previously accumulated or distributed positions.
He noted that the SOL price recently tested a lower trendline. It is now targeting the next volume shelf around $200. If Solana price breaks through that level, the next goal is $218. This aligns with the 0.618 Fibonacci extension level.
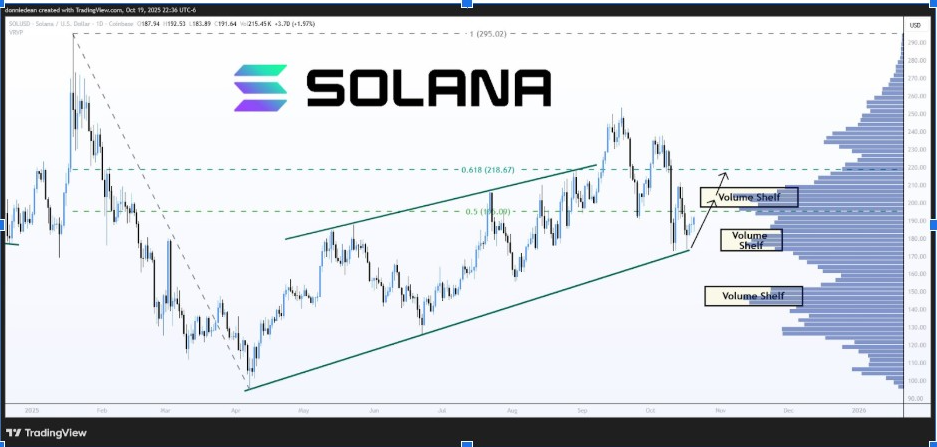
As long as the SOL price remains above the ascending channel, momentum could take the price higher towards $218. Complementing this view, Crypto Caesar displayed a long-term weekly structure with a strong ascending trendline.
He identifies $184.66 as the current support level, calling it Solana’s “pivot for continuation.” Caesar’s analysis suggested that holding above this point has preserved the long-term bullish narrative. Both analysts consider the $184-$200 range to be the center of ongoing accumulation.



