
 Altai the Tiger
 Sword Inu
 streamoors
 IGNITION
 NEAR Protocol
 Pearl
Pearl Injective

Solana crypto price action is now attracting more attention after fresh technical signals emerged on several time frames. The market pulled back sharply in recent sessions, alerting traders as volatility spiked. Analysts are uncertain whether this level marks a cyclical floor or the start of deeper weakness.
TD Sequential Flashes a Cautionary Buy Signal
Price action commentator Ali pointed out a new TD Sequential “1” signal that appeared on the 12-hour chart. This setup forms after nine consecutive candles move in the same direction. It is often a sign of exhaustion and may indicate a change in short-term momentum. This time, this signal has been controversial because it formed at the lower end of the current range.
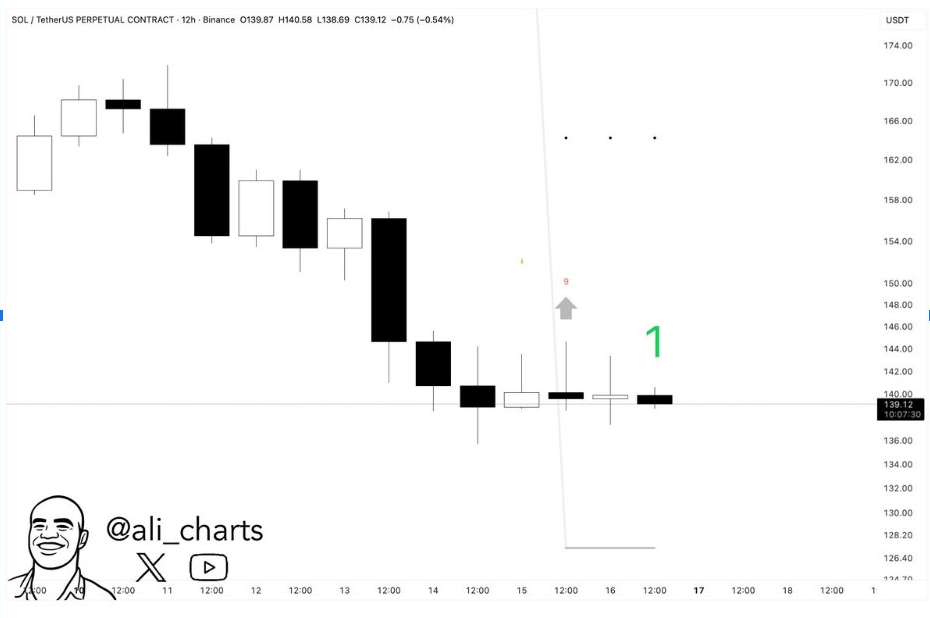
The candles show evident downside pressure, but the indicator indicates selling momentum may be slowing. Solana crypto price remained near $139 when developing this analysis, implying that traders were looking for confirmation above $142.
However, if this region is not held, then the bullish read could be invalidated. The TD model is reactive, so price follow-through is essential to its relevance.
Whale Exit Raises Concern Across Market Watchers
Lookonchain, a widely read on-chain analyst, reported significant whale activity that added pressure to the narrative. A major wallet sold 33,366 SOL, worth about $4.71 million. The holder had bought the tokens seven months earlier for $4.94 million and suffered a loss of almost $230,000. The whale also received 1,283 SOL in staking rewards, but the position still closed in the red.
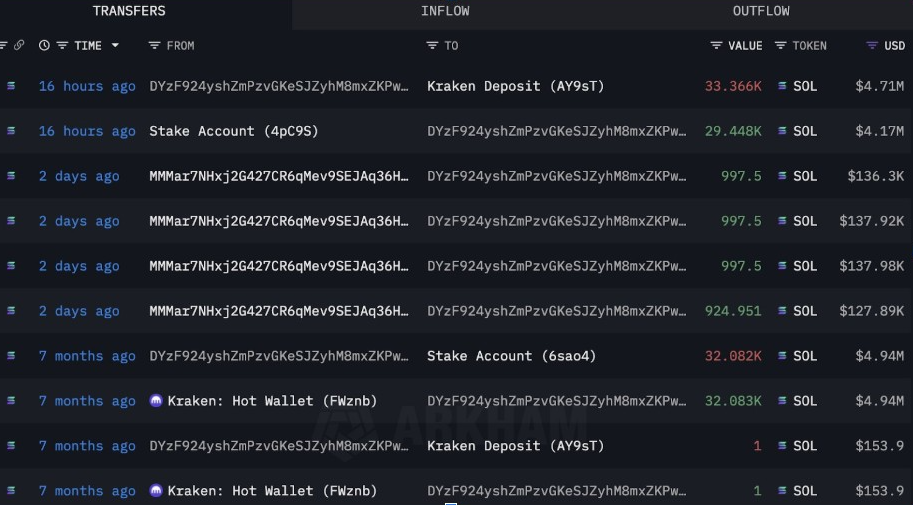
This exit spurred discussion about the weakening of confidence among large holders. More importantly, the move happened close to existing support levels. Traders are concerned that more whales may follow if the price continues to slide.
Such activity often affects sentiment, especially when it coincides with existing downside pressure. Solana crypto was trading just above $135 at press time, a crucial area for many trend preservations.
High-Risk Trade Ideas Add Fuel to Volatility Debate
Trader Tim shared a very aggressive long setup, referred to as a “10/10 risk” position. His chart showed a possible bounce zone developing between $135 and $137. He expected a potential rebound towards $210 if support holds. The trade framework is simple: high risk, high reward, and dependent on strict level respect. His idea is not a prediction but a structure constructed speculatively from past trends.
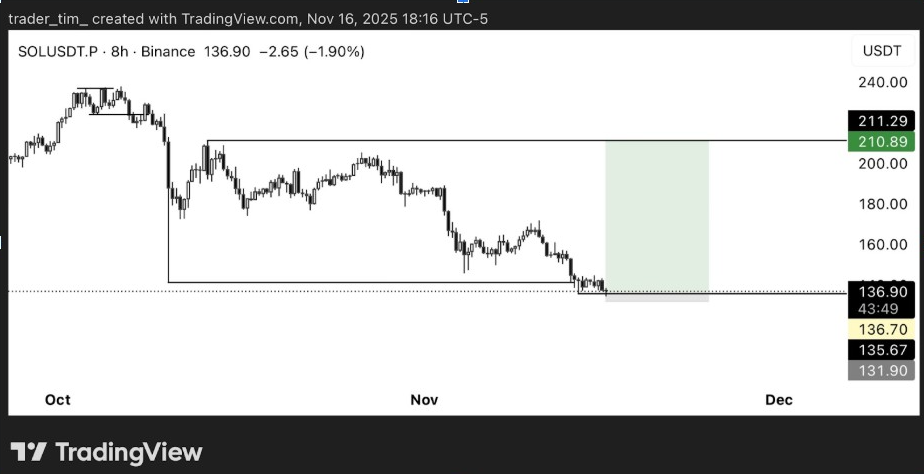
This perspective puts on a contrasting lens. While many are focused on breakdown risk, Tim focuses on compression at a known support cluster. Still, the chart showed a clear downtrend from early November. This means that buyers will need to recover several resistance levels in short order to turn the momentum. Solana price needs significant strength above $148 before a meaningful reversal is likely.
Macro Trend Charts Predict Potential $100 Retest
Meanwhile, Jeremy provided a broader perspective, analyzing Solana’s multi-year structure. His chart shows a long-term descending resistance line cutting across major cycle peaks. Price just broke this trendline again, making it even more significant. When combined with horizontal support levels, the pattern suggests a return to $100 if weakness persists.
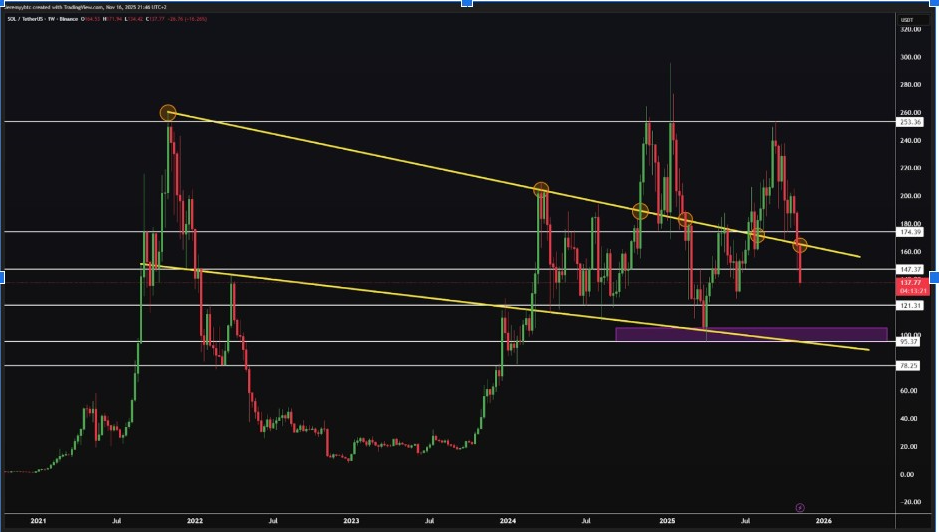
The macro structure highlights definite lower highs from one cycle to another. This trend is consistent with the downturn from the $170 region earlier this year.
However, the chart also highlights a potential demand zone around $95 to $100. Many traders have viewed this area as a long-term accumulation area. Whether the price reaches it depends heavily on buyers’ reactions. Solana crypto is still at a critical point halfway between clear resistance and deep support.



