Boomer
 Covenant x402
 Claudia
 Pearl
Pearl Quantus
 Bitcoin
 NEAR Protocol

Bitcoin price is testing the $64,000 resistance zone as traders track key liquidity levels that could shape the next move. BTC recovered from recent weakness, with buyers attempting to regain control above a major technical barrier. A move above resistance could open a path toward $67,200 and potentially $70,000, while a rejection may expose lower support areas near $60,000.
BTC price remains in a consolidation phase after declining more than 27% in 2026. Analysts are watching spot demand, exchange balances, and derivatives activity as BTC attempts to establish a stronger base.
What’s Next as Bitcoin Price Tests $64,000 Resistance
Bitcoin price is approaching the $64,000 resistance level, which has become a key point for short-term price action. The asset moved closer to a descending trendline formed by recent lower highs on the 12-hour chart.
A sustained breakout above $64,000 could strengthen Bitcoin’s recovery structure. Traders are monitoring whether BTC can close above this level and hold it as support. If the breakout remains intact, the next resistance areas appear between $65,000 and $66,500.
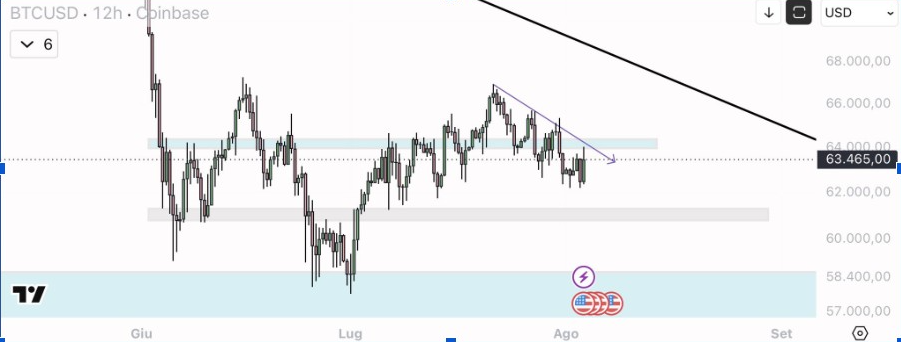
Meanwhile, Bitcoin must avoid another rejection from the current zone to maintain upward momentum. A failure to break above $64,000 could push the price toward nearby support around $62,000.
The broader demand area sits between $61,000 and $62,400. Holding this region allows Bitcoin to maintain its current recovery pattern, while a break below the zone may increase selling pressure toward lower levels.
BTC Liquidity Levels Point Toward $61,500 and $67,200 Targets
Bitcoin’s liquidity map shows large clusters forming both above and below the current price. These areas represent zones where leveraged positions could face increased activity if BTC moves sharply in either direction.
The largest nearby downside liquidity zone sits between $61,500 and $62,400. A move into this region could trigger liquidations among leveraged long positions and create additional volatility. Another liquidity concentration appears near $60,800.
However, Bitcoin also faces several upside liquidity areas. The first targets appear around $65,200 and $65,700, followed by larger clusters between $66,300 and $66,800. Additional liquidity extends above $67,200, creating a potential pathway toward the $70,000 level if buyers sustain momentum.
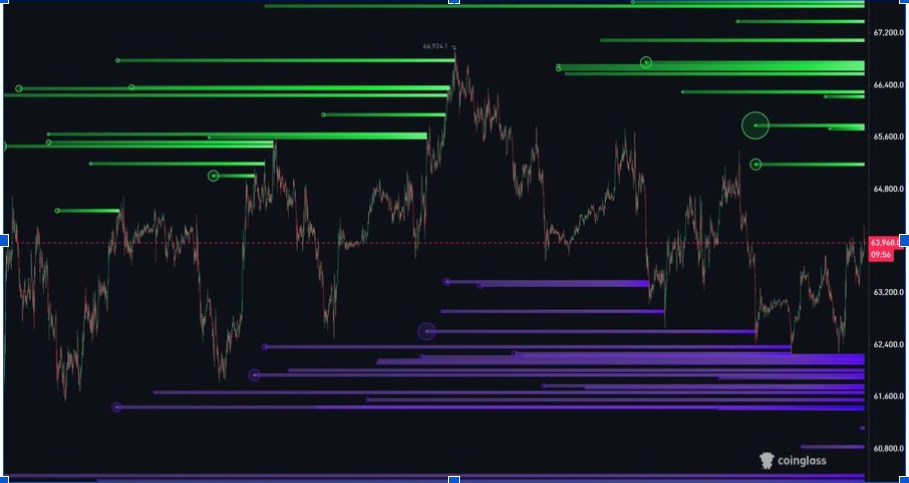
According to market analysis, Bitcoin may first test one side of the liquidity range before moving toward the opposite zone. Price action around $64,000 will likely determine whether BTC moves toward higher resistance or returns to lower support levels.
BTC Crypto Bottom Debate Continues
Bitcoin’s recent price movement has renewed discussion about whether the market has reached a cycle bottom. BTC is down around 27.3% year to date, while analysts continue monitoring whether current support levels can hold.
Low exchange supply and accumulation around the $60,000 to $70,000 range provide support for a potential stabilization phase. However, weak spot demand and defensive derivatives positioning show that traders remain cautious.
On-chain data indicates long-term holders continue to provide support, while Bitcoin exchange balances remain relatively low. At the same time, leverage concentration in derivatives markets creates a risk of sudden price swings.
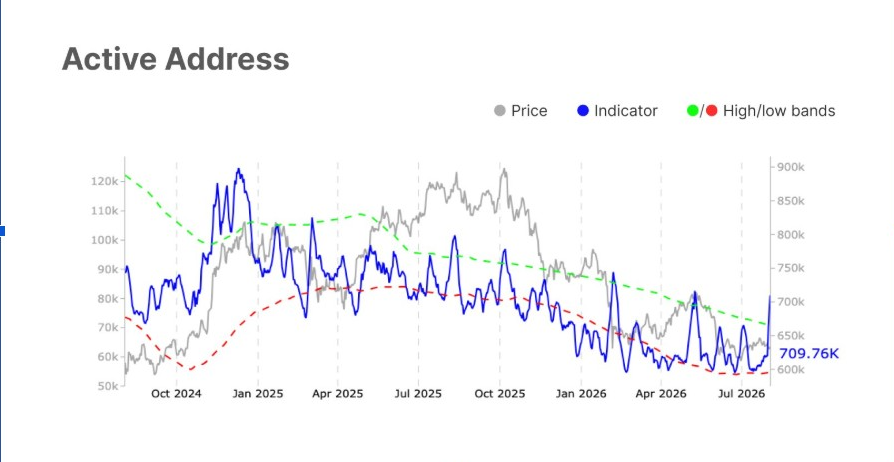
Also, BTC active addresses jumped to 709.76K, rebounding sharply from recent levels near 600K.
Market forecasts assign a higher probability to Bitcoin stabilizing above the $58,000 to $60,000 range during the next quarter. However, another decline toward $50,000 to $58,000 remains possible if selling pressure increases.
Bitcoin’s path toward $70,000 depends on whether buyers can overcome the $64,000 resistance zone and maintain the bullish rally. A successful breakout could push BTC crypto toward $67,200 and later test higher levels near $70,000.