Altai the Tiger
 IGNITION
 streamoors
 Sword Inu
 NEAR Protocol
 Injective
 Quantus
Key Insights:
- XRP price trades near $1.08 while short-term resistance holds around $1.09.
- Monthly support sits between $1.00 and $0.95, with $0.80 as the deeper risk.
- A confirmed breakout could expose $1.15, $2.00, and the larger $3.50 target.
XRP price is compressing near $1.08 as buyers defend rising support and sellers control a descending resistance line. The narrowing range places the market close to a decisive breakout point.
Short-term charts focus on $1.09, while broader setups track support between $1.00 and $0.95. A break may decide whether XRP extends toward $3.50 or falls toward $0.80.
XRP Price Compresses Below $1.09
XRP price trades around $1.08 after recovering from the $1.05 region. The hourly chart shows the price returning toward a heavy resistance band near $1.09. CW identifies that level as the trigger for a short-term bullish shift.
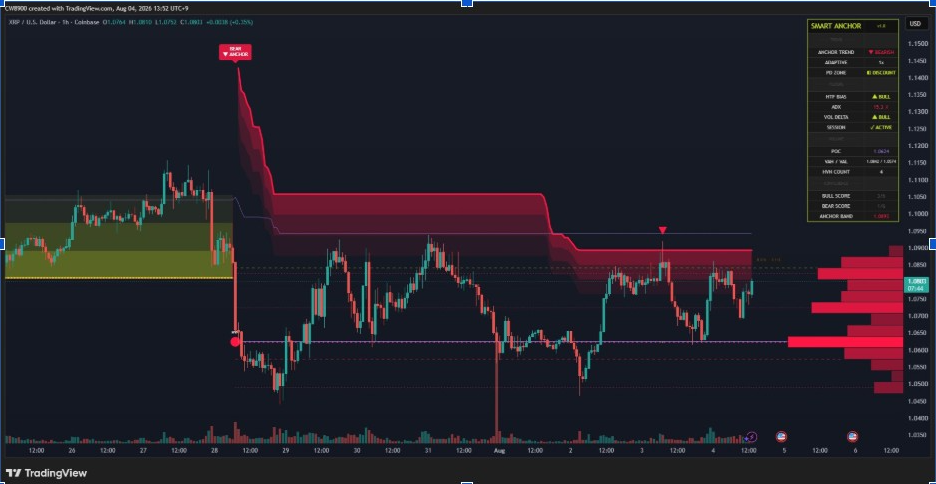
The chart places the bearish anchor band around $1.0893. XRP price also faces nearby volume resistance between roughly $1.084 and $1.09. Buyers must close above this zone before targeting $1.10 and $1.15.
However, stronger buying interest appears near $1.062, which matches the chart’s point of control. Losing that level could expose $1.057 and the broader $1.05 support area. A rebound from either zone would keep the current range intact.
XRP Crypto Triangle Pattern Signals a Larger Move
Meanwhile, the daily chart showed XRP price trading inside a tightening symmetrical triangle. Falling resistance now meets rising support close to the current market price. Analyst Bird’s setup places the upper boundary near $1.10.
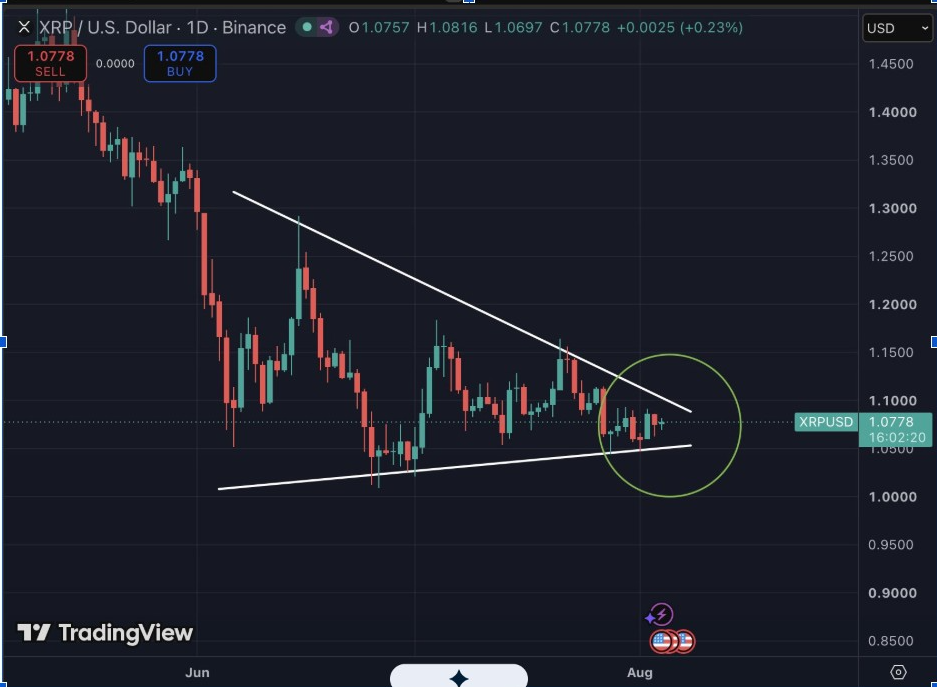
The lower trendline rises through the $1.04 to $1.05 region. XRP price has also formed smaller candles as both boundaries narrow. This compression can produce a larger move after either trendline breaks.
XRP price daily close above resistance would improve the structure and weaken the recent sequence of lower highs. On the other hand, a close below support could expose $1.00. The chart therefore, supports patience until price confirms a direction.
The analyst also expects policy developments to increase volatility during the week. That expectation places more attention on the triangle’s final section. Any breakout still needs volume and a successful retest.
Long-Term Support Defines the Downside
EGRAG Crypto’s monthly chart shows XRP price approaching the 100-month exponential moving average. The analyst previously expected $2.00 to act as macro support. Price instead lost that level and the 50-month average.
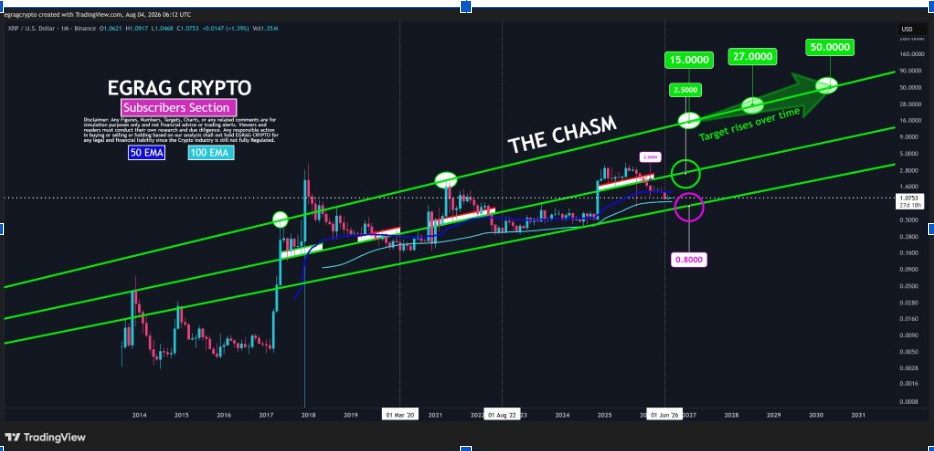
XRP crypto now trades closer to the lower boundary of a long-running ascending channel. EGRAG noted $1.00 to $0.95 as the healthier macro retest zone. Holding this region would preserve the wider channel structure.
The chart also marks $0.80 as the maximum downside scenario. That level sits near the channel floor and a deeper historical demand area. Still, the channel projects considerably higher levels over time.
EGRAG maps future targets near $15, $27, and $50 if XRP preserves the structure. Those projections require years of development and a firm recovery above $2.00.
XRP Crypto Breakout Setup Keeps $3.50 in View
Notably, top analyst Javon Marks sees a break from a long descending structure on the daily chart. The resistance line begins near XRP’s 2025 peak around $3.60. It then connects several lower highs across the decline.
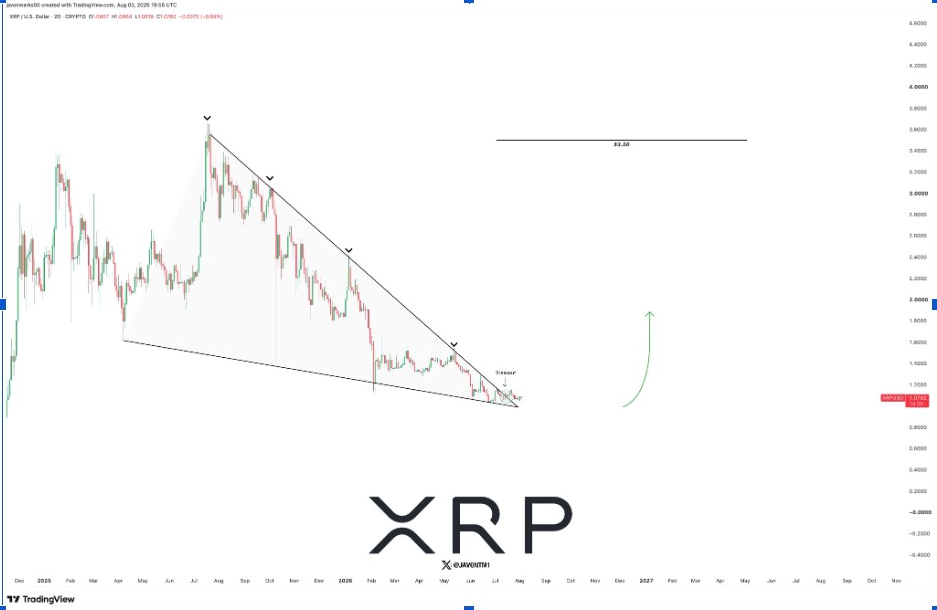
Price recently moved above that descending boundary near the $1.08 region. Marks projects a climb toward $3.50 after the breakout. The target represents an increase of more than 200% from current levels.
Nevertheless, the move still needs confirmation through sustained trading above former resistance. A failed retest could return XRP inside the larger pattern. Near-term resistance at $1.09 therefore matters for both short and long timeframes.
Clearing $1.09 would strengthen the breakout case and place $1.15 in focus. Further gains could expose $1.20 and the former $2.00 support. XRP must protect $1.05 during any pullback to preserve that path.