Doge Pepe
 Crawlerpad
 Quant
Quant Pearl
Pearl Starknet
 Optimism
 Zylo Ecosystem
Key Insights
- Shiba Inu trades at $0.00001276, holding above key support of $0.00001200 amid rising open interest.
- SHIB burn rate surged 2408.42% in 24h, removing billions of tokens from circulation.
- Over 86% of SHIB liquidations in 24h were shorts, suggesting short squeeze potential.
Shiba Inu (SHIB) has seen its burn rate surge by 2408.42% in 24 hours, drawing renewed market attention. Currently trading at around $0.00001276, SHIB remains in consolidation.
This sharp increase in burn rate raises speculation about a possible breakout above the key $0.00008915 resistance. Technical indicators have started showing early bullish signals. These are prompting traders to monitor closely for potential momentum shifts.
Shiba Inu Burn Rate Jumps Over 2400% Amid Rising Volume and Open Interest
Shiba Inu’s supply-reduction strategy accelerated sharply, with a 2408.42% increase in its burn rate over the last day. The total supply now stands at approximately 584.49 trillion tokens. Besides, nearly 999 trillion tokens have been permanently removed from circulation since the project’s inception.
Alongside the burn activity, 24-hour derivatives volume climbed to $124.36 million, up by 6.02%. Open interest rose to $164.31 million, marking a 4.70% increase. These movements suggest that traders are entering new positions, signaling anticipation of a price move rather than market exit.
SHIB’s market cap also saw a 3.86% increase, reaching $7.76 billion. As more traders respond to the burn figures and rising metrics, short-term volatility could increase, especially if buying interest accelerates from retail participants.
Shiba Inu Technical Indicators Show Early Signals of Bullish Momentum
According to the TradingView 4-hour chart for Shiba Inu on Binance, SHIB is showing early signs of a potential trend reversal. Price action has recovered from a recent low near $0.00001200.
SHIB has been consolidating between $0.00001305 and $0.00001321, forming a minor uptrend. Key resistance lies at $0.00001350, followed by $0.00001450–$0.00001600, while support holds firm at $0.00001200. A series of higher lows and highs suggests a bullish structure, possibly forming a flag or pennant pattern.
Momentum indicators support the bullish case. The MACD shows a fresh bullish crossover, with the MACD line crossing above the signal line and the histogram turning positive. That’s often a precursor to upward movement.
The RSI was 51.32 at press time, signaling mild buying pressure without being overbought. A push above 60 RSI could further validate bullish momentum.
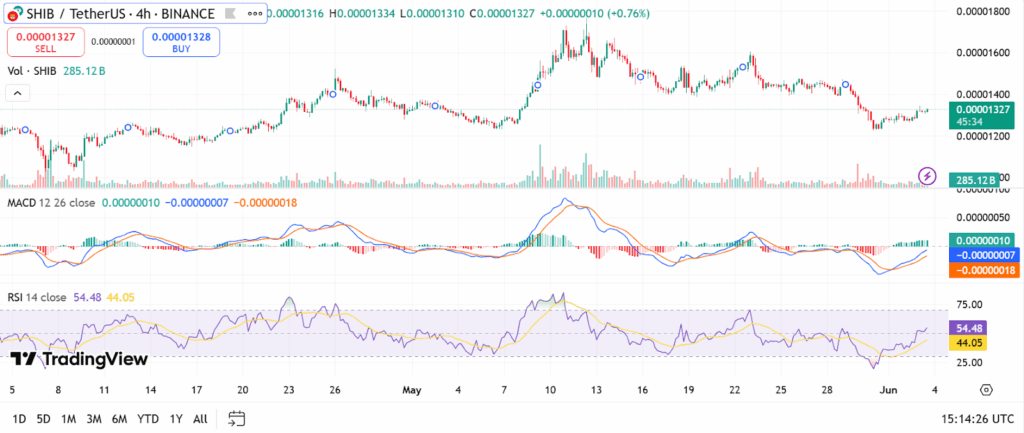
While volume remains below the monthly average, recent green volume spikes during rebounds suggest accumulation interest. A breakout above local resistance, supported by a volume surge, could mark the beginning of a stronger upward trend.
SHIB Derivatives Market Shows Signs of Short Squeeze Formation
Liquidation data from the derivatives market reveals strong short-side pressure. In the last 24 hours, a total of $82.83K in positions were liquidated, with 86.4% of these being short positions.
When shorts are liquidated in large numbers, traders are forced to buy back. It leads to increased upward pressure on the price.
Long/short ratios also show divergence between major exchanges. OKX reports a ratio of 2.27, indicating more than twice as many long accounts as shorts. In contrast, Binance sits closer to 0.98, showing a more neutral stance.
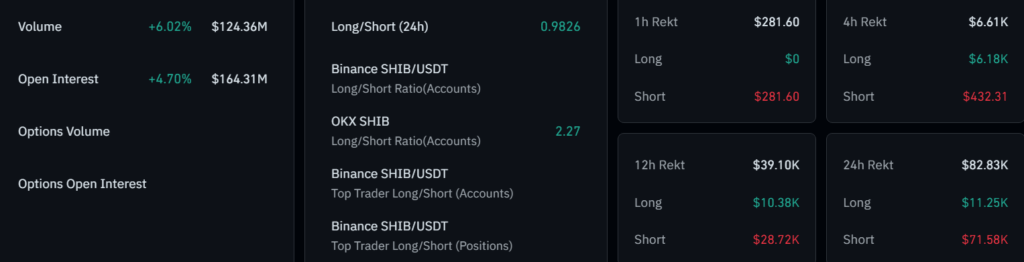
The futures market remains the dominant vehicle for Shiba Inu speculation. Current data shows little to no major activity in SHIB options, suggesting that institutional participation is still limited.
As a result, retail-driven momentum and futures trading are likely to influence short-term price movements more significantly.
Shiba Inu Structure and Key Levels Suggest Breakout Setup
Shiba Inu’s weekly chart is showing an Inverse Head and Shoulders pattern. According to Javon Marks, it could mark the beginning of a bullish reversal.
SHIB is remaining near the range of $0.00001200 to $0.00001250, forming a reliable base. It indicates buyers are accumulating the cryptocurrency.
If the price continues to rise due to buying interest, it may soon go past $0.00001500. The downtrend led to the left shoulder, then the recovery became more modest and was followed by the head dip, as the buying increased, which suggested bearish momentum was decreasing.
The development of a higher low in the right shoulder equalized both shoulders and presented sellers gaining an edge. If the neckline (the connection between the highest price points between the shoulders and head) is broken with significant volume, it means the pattern is valid.
It could set off an upward trend. Besides, investors could expect the first notable rise to reach $0.000081, which would provide a 503% increase.
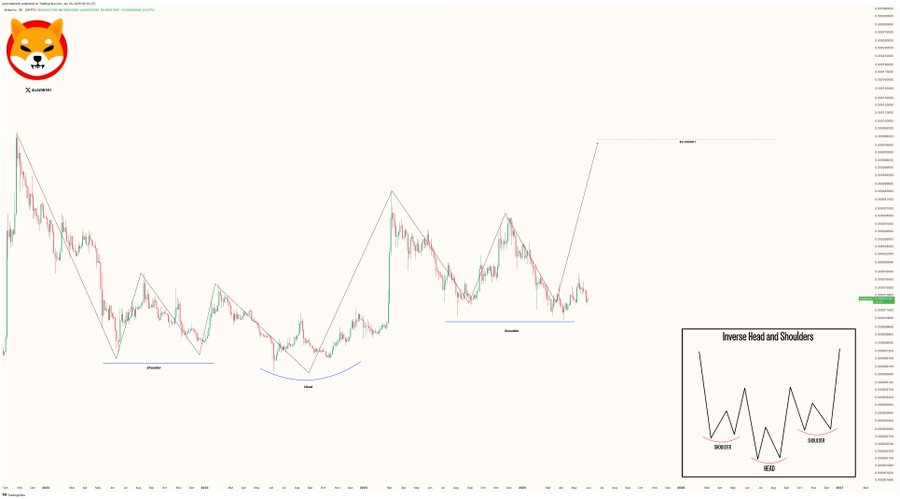
However, there is still a risk. As the pattern may lead to a false breakout, it makes sense to have a stop-loss below the neckline or right shoulder. Resistance around $0.00001450–$0.00001500 and support at $0.00001200 mean SHIB could push in a clear direction soon.