Zerebro
 Bitcoin
 Quantus
 Pearl
Pearl Starknet
 ZKsync
 NEAR Protocol

Key Insights:
- Solana price has broken out of an ascending triangle with a projected upside target of $164.
- A confirmed breakout above $200 could validate a cup-and-handle pattern with a 5X to 10X target.
- Solana derivatives show rising bullish momentum as longs dominate and shorts face $11.5M in 24h liquidations
Solana (SOL) price current chart formations and derivatives activity have drawn close attention as traders assess whether the asset can initiate a long-term breakout. With strong bullish patterns and rising futures volume, analysts are watching the $200 level as a pivotal threshold.
Solana Price Breaks Out of Triangle With $164 Target
Recently, Solana price broke out of an ascending triangle, considered a type of continuation pattern. Analyst Ali Martinez pointed out that the trading session saw horizontal resistance at $155. It had lower lows on each dip, indicating more demand when the price fell. After the price crossed the resistance, it quickly went above $155.20, marking the breakout.
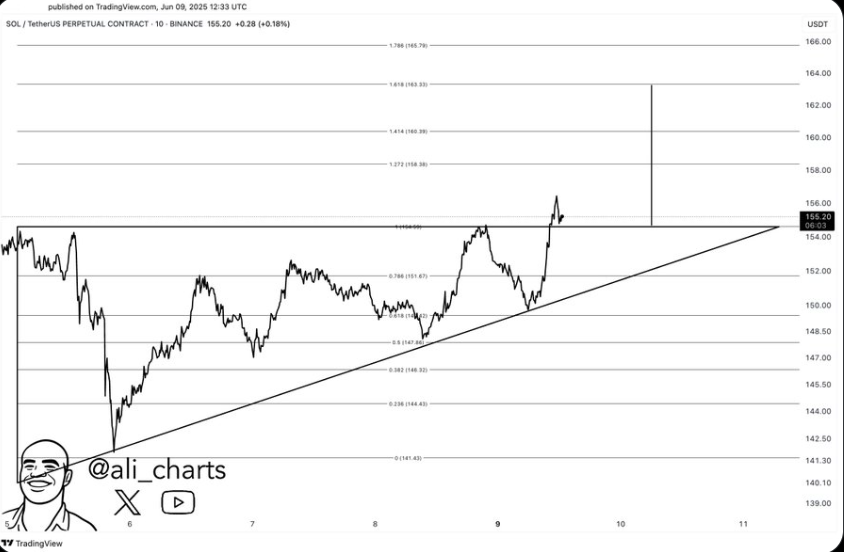
Consequently, the projected target based on the triangle’s height aligns with $164. This level also corresponds with the 1.618 Fibonacci extension zone, reinforcing the near-term price target.
In addition, a move above $164 could further strengthen bullish sentiment soon. If price action stays above the breakout zone, it may create an opportunity for testing higher resistance, especially above the $200 ceiling.
A Break Above $200 Could Activate Rally
Beyond the short-term triangle, Martinez pointed out that Solana price is also showing signs of a larger technical pattern, specifically, a cup-and-handle formation on the weekly chart. The setup began in late 2021 and lasted through 2023, which supports the idea of continued accumulation. The handle, formed in early 2025, narrowed price movement into a descending channel before recent consolidation.
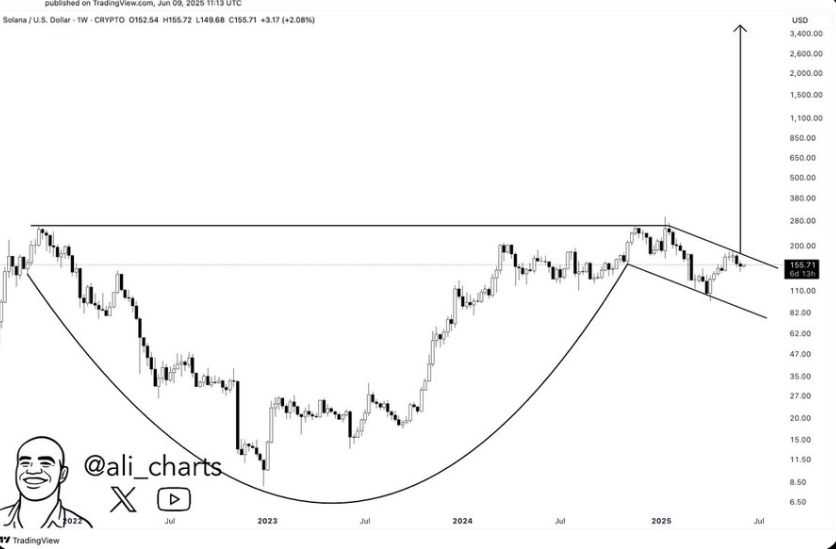
In this pattern, $200 marks the neckline. If this level is broken above with solid trading volume, it could show that the cup-and-handle pattern is in place.
According to the analyst, a breakout of this kind may result in a 5X to 10X move towards zones located between $1,000 and $2,000. Subsequently, the validity of these projections depends on the depth of the cup pattern and is mostly used in times of rising markets.
Derivatives Data Shows Bullish Sentiment
More so, data from the Solana derivatives market showed a considerable increase in speculative positioning. Overall trading value rose by 47.62% to $13.24 billion, and open interest climbed by 6.30% to $6.89 billion. Activity in options markets is picking up, as volume rose by 134.71% and open interest stands at $2.91 million.
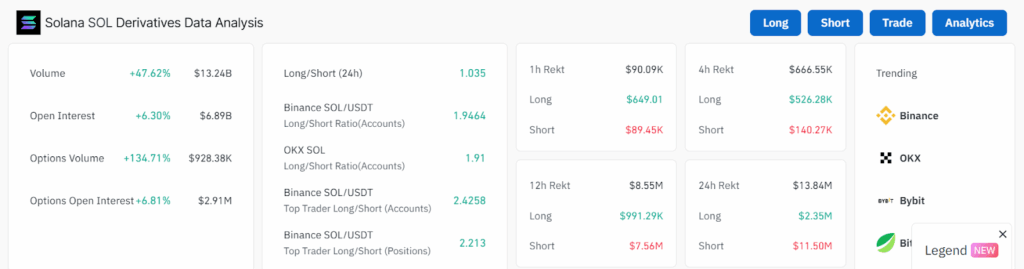
Additionally, the dominance of long positions in the exchange highlighted that traders expect the price to rise. On Binance, the long/short ratio is 1.9464, while OKX notes 1.91.
While there are more short positions than long positions among Binance traders, long positions still have more than double the number. These figures indicate that many large traders are positioned for an upward SOL price movement.
Short Liquidations Increase as Longs Build Positions
Meanwhile, Liquidation data indicated that the recent positive trend continues. Over the past day, over $13.84 million in Solana positions were closed due to losses. A total of $11.50 million from short positions and $2.35 million from longs was seen in this data. This imbalance reflected the strength of the recent rally and suggests that bearish traders have been forced to exit due to rising prices.
Short liquidations were noticeable in various periods. During the last 12 hours, short positions liquidated $7.56 million, whereas long positions liquidated only $991,290. Similarly, over 4 hours, there were $140,270 short liquidations, versus $526,280 for the longs. Overall, these values suggest the market is shifting towards growing bullish tendencies soon.
At the time of writing, Solana price rose 1.68% over the past 24 hours to $158, rebounding from a low of $155.34. Intraday strength showed sustained buying above the $156 level.
Disclaimer
In this article, the views, and opinions stated by the author, or any people named are for informational purposes only, and they don’t establish the investment, financial, or any other advice. Trading or investing in cryptocurrency assets comes with a risk of financial loss.