Pearl
Pearl Bitway
 Pudgy Penguins
 Optimism
 Walrus
 NEAR Protocol
 Pons
Pons

Key Insights:
- Six of the top seven whale positions on Hyperliquid crypto are shorts, with several already in deep unrealized losses.
- Shorts on Hyperliquid show clustered liquidation levels, increasing squeeze risk.
- HYPE Price action on the 4H chart is consolidating above the 50 and 100 EMAs, signaling a potential breakout setup.
Analysts monitored Hyperliquid crypto closely, watching a setup that may result in forced liquidations and a price surge. With whales heavily positioned on one side, the conditions suggest a possible short-squeeze scenario.
Hyperliquid Crypto Whale Short Positions Dominate the Board
Recent data shared by analyst Ted Pillows on Hyperliquid crypto showed that six of the top seven whale positions were short. A single long exceeding $224 million was an exception and was profitable. The other large positions were shorts, and some with large unrealized losses.
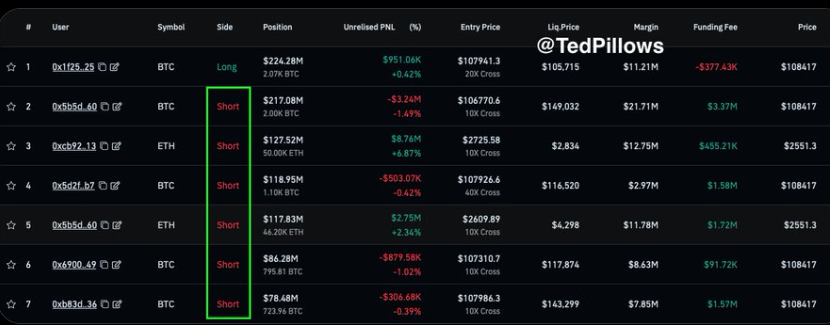
Of these short holders, some reported positions with unrealized losses of as much as hundreds of thousands, up to more than $870K. These traders may be taking shorts with leverage, positioning them to a larger risk at a reduced cost or an increased charge.
Consequently, this clustering of the bearish bet is likely to create the potential of a short squeeze if Hyperliquid crypto starts moving higher toward primary liquidation ranges.
Clustered Liquidation Levels Create Compression Risk
More so, as indicated by the liquidation price data, the short positions had tightly interlocked thresholds. This closeness of these levels implied that a moderate progression in price movement can result in the beginning liquidation of several positions, one right after another.
Besides, such alignment promotes the liquidity cluster effect, which occurs when stop-outs can align and cause price movement to gather momentum. The leverage noted in certain of these positions was as high as 40. Consequently, there was a risk that a small Hyperliquid crypto breakout above the present resistance level could cause forced liquidations and a subsequent rise.
Hyperliquid Crypto Derivatives Signal Growing Short Squeeze
Moreover, recent HYPE derivatives data from CoinGlass revealed a 57% surge in trading volume, reaching $1.34 billion, while open interest dropped by 3.52% to $1.73 billion. The 24-hour long/short ratio stood slightly above parity at 1.0467, with Binance and OKX showing long-favored ratios above 1.10, indicating growing bullish positioning.
Furthermore, liquidation data indicated a long-standing rise in losses recovered. Over the past 12 hours, $932K in long positions were rekt, compared to $43.37K for shorts.
However, in the 24-hour window, short liquidations rose to $61.71K. The trend suggested gradual pressure building on short positions, especially on Binance, where top trader ratios exceed 1.68.
HYPE Price Compression Above Key Averages
Meanwhile, an analysis of the 4-hour chart of HYPE/USDT indicated that Hyperliquid crypto has been trading in a narrow range. The asset is already grouping above the 50 and 100 exponential moving averages (EMAs), creating a base frequently followed by directional movement. These moving averages have also flattened, indicating the market may be coiling before its next major move.
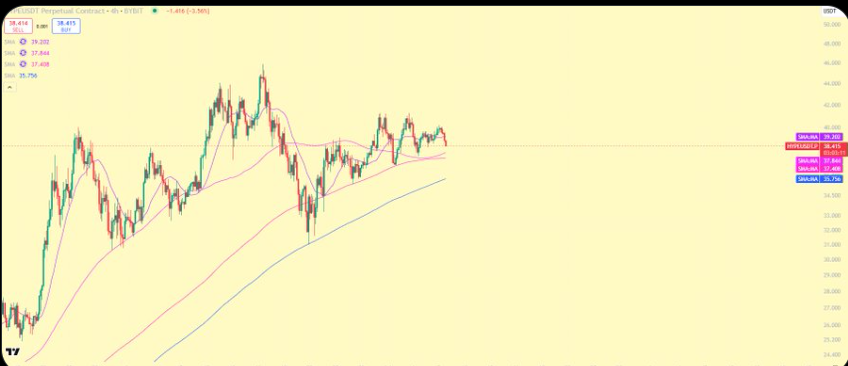
Besides, the intersection of 50 EMA and 100 EMA below the current price means there was still support. When consolidation occurs, a price hold may be above these levels, which may signify bullish control.
Additionally, the 200 EMA rests well below the current range, reinforcing the structure’s upward bias. This type of setup is typically used to assess whether the market is primed to continue its recent trend or is preparing to reverse.
Hyperliquid’s recent structure combined technical pressure with leverage-based vulnerability. As more liquidity builds near key price levels, a breakout, if initiated, could develop into a short squeeze that drives further price discovery.
Meanwhile, a recent analysis showed Hyperliquid crypto maintaining a bullish structure within the $30–$40 range, with price rebounding near $33–$34 support. As long as HYPE held above $30, mid- to long-term accumulation remained intact.
A confirmed breakout above $40 could trigger a sharp rally toward $43.50–$45, while a drop below $30 may shift sentiment toward a bearish outlook.
Disclaimer
This article is for informational purposes only and provides no financial, investment, or other advice. The author or any people mentioned in this article are not responsible for any financial loss that may occur from investing in or trading. Please do your research before making any financial decisions.