Doge Pepe
 Optimism
 Pearl
Pearl Quantus
 Bitway
 Pons
Pons NEAR Protocol
Key Insights:
- James Wynn has boldly predicted that PEPE will outperform the top 50 altcoins during the bull run.
- PEPE continues to flow out of exchanges, hinting at ongoing accumulation.
- A daily candle closing above $0.0000155 could propel PEPE by 35%.
PEPE, the popular third-largest cryptocurrency, appears bullish and is poised for a massive price uptick. Analyzing its price action, expert traders like James Wynn have made bold predictions that have gained widespread attention.
James Hynn’s Bold PEPE Price Prediction
On July 22, 2025, James Wynn posted on X showing strong optimism about the PEPE price. He highlighted an explosive move where the meme coin surged dramatically.
According to Wynn, one hourly “god candle” wiped out 33 hours of previous trading action. He also emphasized that this spike in PEPE price came with significant trading volume.
In the post, Wynn also talked about Bitcoin Dominance, which is falling and signaling strength for the meme coin. He further stated that PEPE has already outperformed Ethereum in the recent price uptick.
It will likely outperform every other top 50 cryptocurrency in this cycle. He also discussed the meme coin’s market cap, speculating that PEPE could reach $69 Billion in this cycle.
Wynn connected this prediction to the past meme coin rally. At that time, Dogecoin (DOGE) and Shiba Inu (SHIB) reached market caps of $88 Billion and $42 Billion, respectively.
This X post has garnered massive attention from crypto traders and investors due to Wynn’s strong presence in the market. He is not just commenting but is also renowned for his bold bullish bets in the crypto market.
PEPE CoinCurrent Price Momentum
Despite this bullish outlook, the PEPE price has remained negative throughout the trading session. The meme coin is hovering near the $0.00001355 level at press time. It has lost 2.10% over the past 24 hours.
Despite this dip, participation has remained unchanged. CoinMarketCap data revealed that PEPE has recorded a decent 1.20% jump in its trading volume during the same period.
PEPE Price Action and Technical Analysis
PEPE price is forming a bearish candlestick pattern when combining this price dip with the daily chart. However, the pattern is not yet confirmed.
According to expert technical analysis, the PEPE is in an uptrend. However, it is consolidating near a key resistance level of $0.000014.
The daily chart shows a potential bearish evening star candlestick pattern forming at a key resistance level. This suggests downside pressure may soon follow.
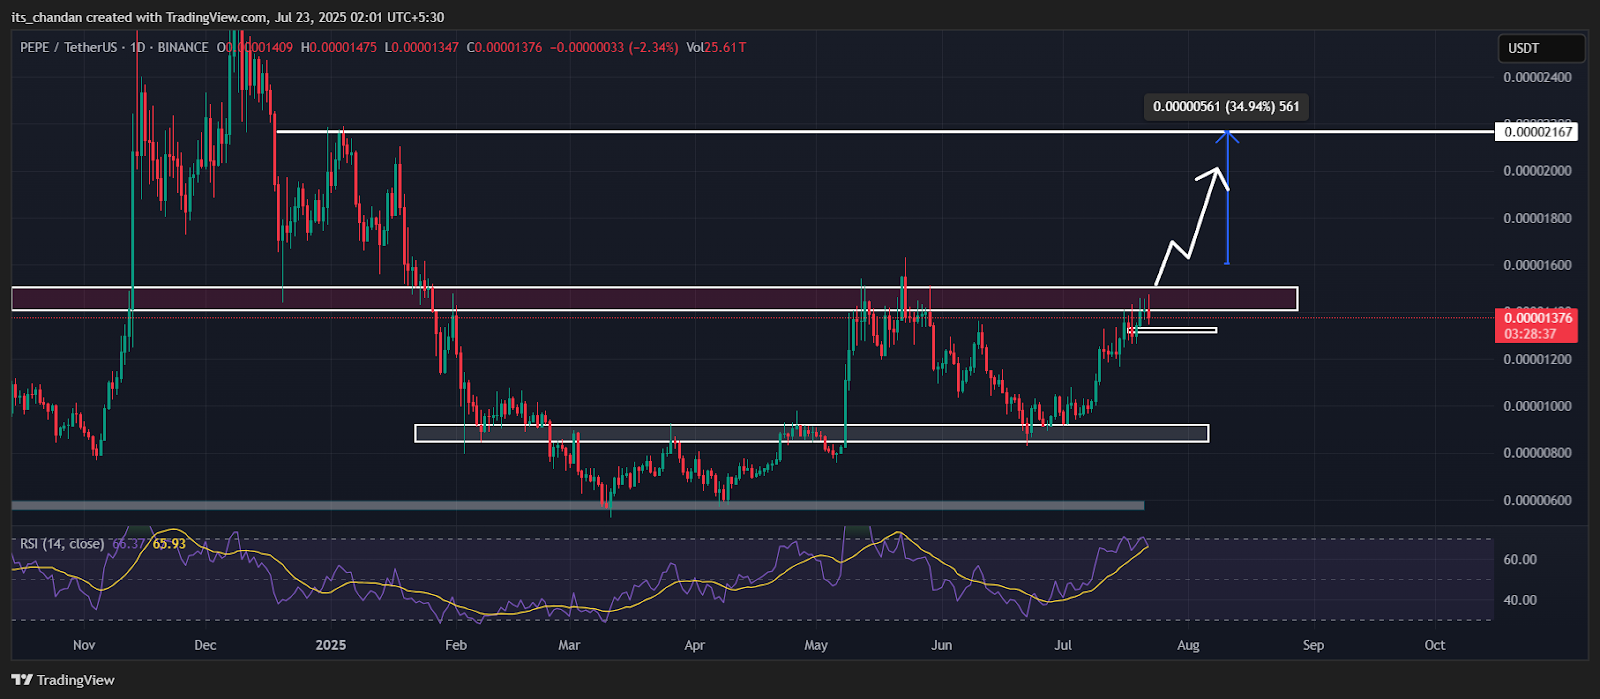
The key level to watch here is the local support at $0.000013. Based on recent price action, PEPE needs to hold this level to continue its upside momentum and remain uptrend.
If PEPE maintains local support, the setup could favor a breakout above resistance. This could trigger a sharp surge in PEPE price, opening the door for a substantial rally.
The bull run could only begin if PEPE closes a daily candle above the $0.0000155 level. On the other hand, if PEPE falls below the $0.000013 level, a massive price drop could occur.
RSI Insights and $14.20M of PEPE Outflow
The technical indicator Relative Strength Index (RSI) stood at 65. This indicates that the asset is nearing overbought. However, it still has enough room to continue its upside momentum and break the prolonged key level.
PEPE price action is being strengthened by recent activity from investors and long-term holders. On-chain analytics firm Coinglass revealed the same.
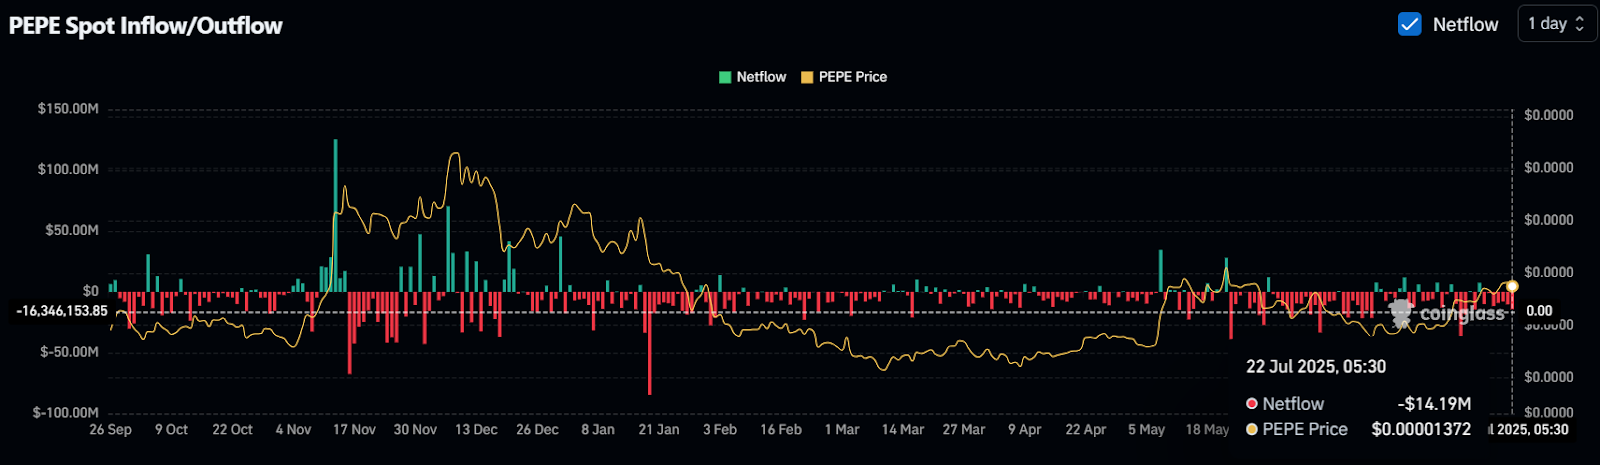
Data from spot inflow/outflow shows that investors have seized the current opportunity. They appear to be accumulating tokens. The data indicates that over $14.19 Million worth of PEPE has left exchanges, hinting at potential accumulation.
Disclaimer
This article is for informational purposes only and provides no financial, investment, or other advice. The author or any people mentioned in this article are not responsible for any financial loss that may occur from investing in or trading. Please do your research before making any financial decisions.