Pearl
Pearl ZKsync
 Bitcoin
 Starknet
 Quantus
 Puffer
 Lighter
Nvidia stock has skyrocketed over the past few decades. It grew from a small semiconductor company into the world’s largest firm, now valued at over $4.3 Trillion.
It has increased by 1,250% in the last five years, raising concerns that it has become a highly overvalued company. This article conducts a valuable analysis to establish whether it is a bargain or a value trap.
Why Nvidia Stock Price Has Soared
NVDA stock price has surged due to its leading role in key global sectors. For example, its GPUs are used widely in the Bitcoin mining industry. Nvidia chips are widely used in personal computers.
They’re also essential for high-performance gaming. More importantly, Nvidia dominates the market for artificial intelligence hardware. AI has become the fastest-growing industry globally.
Nvidia leads the AI chip market thanks to its superior hardware. Its proprietary CUDA platform gives it a major edge over competitors like Intel and AMD. CUDA is a computing platform widely used in technology to implement parallel processing.
The company’s revenue has been phenomenal in the past few years. Its annual revenue has grown from $16 Billion in 2021 to over $165 Billion in the trailing twelve months (TTM). Similarly, the company’s net profit has jumped from $4.3 Billion to $85 Billion in the same period.
Analysts believe Nvidia stock still has strong growth potential. Nvidia’s leadership in AI and emerging fields, such as quantum computing, fuels this optimism.
Yahoo Finance estimates that the company’s annual revenue will reach $206 Billion by 2025. By 2026, that figure is projected to climb to $275 Billion. Another estimate suggests that its annual revenue will surge to over $1.01 Trillion by 2035.
Nvidia Valuation Analysis
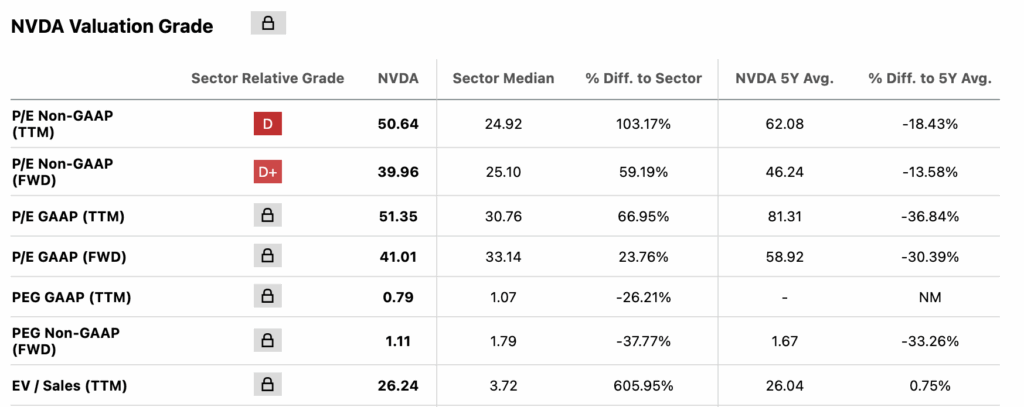
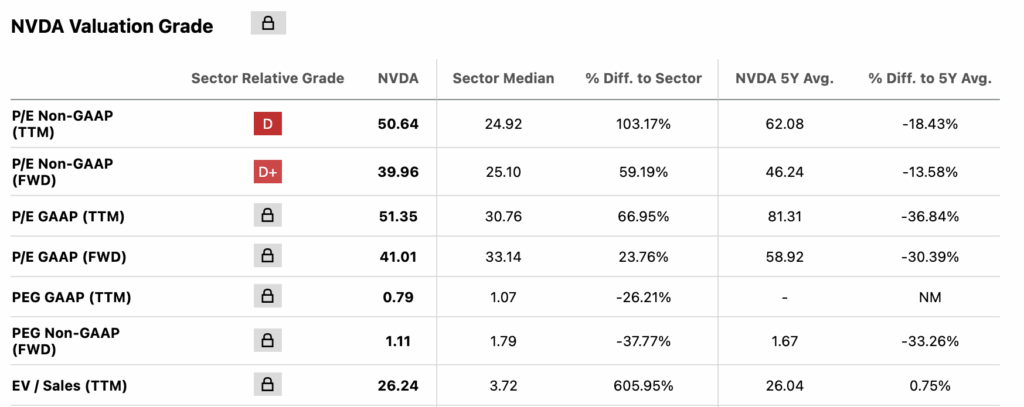
One of the best ways to value a company is to compare its current price and its earnings and sales. Seeking Alpha reports the company’s forward P/E ratio is 39 using non-GAAP metrics.
Using GAAP standards, the ratio rises to 41. This reflects investor expectations for future earnings. These numbers are much higher than the forward S&P 500 Index ratio of 22.
Nvidia’s rapid growth makes NVDA stock likely to command a higher valuation. Its strong competitive edge in the semiconductor space reinforces that premium.
Nvidia’s numbers are actually lower than its historical averages. The five-year average of the two is 46 and 58. This indicates that it is trading at a bargain price, as concerns about an AI bubble persist.
The P/E ratio has a central limit in that it does not factor in a company’s growth rate. As such, analysts tend to use the PEG ratio. In this case, Nvidia stock currently has a trailing PEG ratio of 0.7. This suggests it’s undervalued relative to its expected earnings growth.
It is lower than the sector median of 1.07. Its forward one is 1.1, also lower than the sector median and its five-year average. Therefore, based on these multiples, there are signs that the company is a bargain today.
Another valuation method is known as the Rule of 40, which examines a company’s margins and growth. NVDA stock boasts a forward revenue growth rate of 58% and a profit margin of 52%. Combined, this gives it a stellar Rule of 40 score of 110.
It is significantly higher than the key level of 40. However, this valuation metric is standard in software companies.
Nvidia Stock Price Technical Analysis
The daily timeframe chart shows that the Nvidia stock price has been in a strong uptrend in the past few years. It has formed an ascending channel and is now hovering near its lower side.
NVDA stock price is trading above both its 50-day and 100-day EMAs. It also sits above key support and resistance levels identified by the Murrey Math Lines tool.
The stock is expected to rebound and climb toward the key resistance level of $200. If momentum continues, it could overshoot to an extreme level of $212.