Doge Pepe
 Zylo Ecosystem
 Crawlerpad
 Pearl
Pearl Quantus
 Starknet
 Quant
Quant

The MST stock price remained under intense pressure in the past few months. It has plunged in the past six consecutive weeks, its longest streak in years. Strategy was trading at $198 on Monday, its lowest level since October 14, down by over 63% from its highest level in 2024. So, will it rebound after getting oversold?
MSTR Stock Price Has Become Highly Oversold
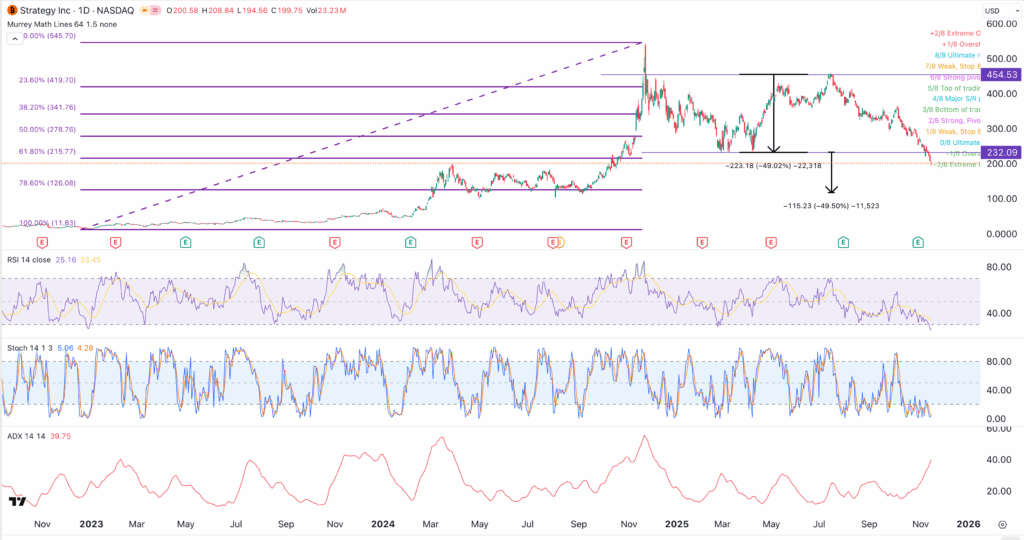
The daily timeframe chart shows that the MicroStrategy stock price has been in a strong freefall in the past few months, moving from a high of $456 in July to the current $199.
Top oscillators show that the stock has become highly oversold. For example, the Relative Strength Index (RSI) has dropped to the oversold level of 25. Similarly, the two lines of the Stochastic Oscillator have moved to the oversold level of 6.4.
The same is happening with the Murrey Math Lines as the stock is approaching the extreme oversold level at 187.
These oscillators suggest that the downtrend is gaining momentum, which is evidenced by the Average Directional Index (ADX), which has jumped to 40, its highest level since December last year. A high ADX suggests that the trend is accelerating.
The MSTR stock price exhibits other bearish signs, including its continued trading below the 50-day and 200-day Exponential Moving Averages (EMAs). These two averages crossed each other recently, forming the risky death cross pattern.
The Supertrend indicator has also remained in red. Therefore, these indicators suggest that the Strategy stock price has more downside to go, with the next key target being at $113, its lowest level in September last year. This target price is about 47% below the current level.
Strategy Stock Price Has Formed a Double-Top on the Weekly Chart
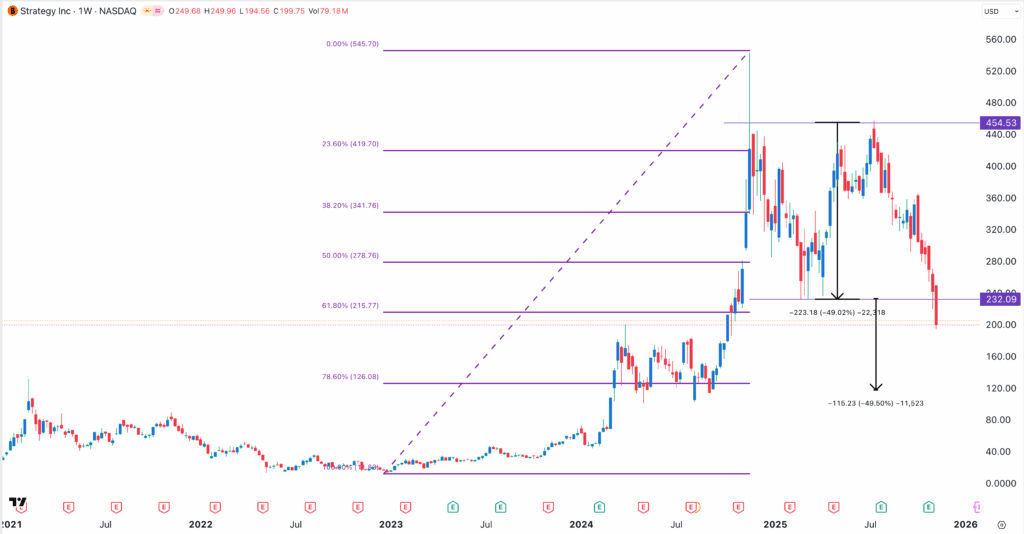
The weekly timeframe chart suggests further downside in the near term. It shows that the coin formed a double-top pattern at $455 and a neckline at $232.
The price target in this pattern is estimated by first measuring the distance from the double-top level and the neckline, which is about 49% today. Measuring the same distance from the neckline gives the target price at $117. This target is almost similar to the one on the daily chart.
The other reasons why the Strategy stock price may continue falling is that it has already moved below the 61.8% Fibonacci Retracement level at $215. In most cases, rebounds typically occur when an asset reaches the 61.8% retracement level.
Bitcoin Price Death Cross Points to More Downside
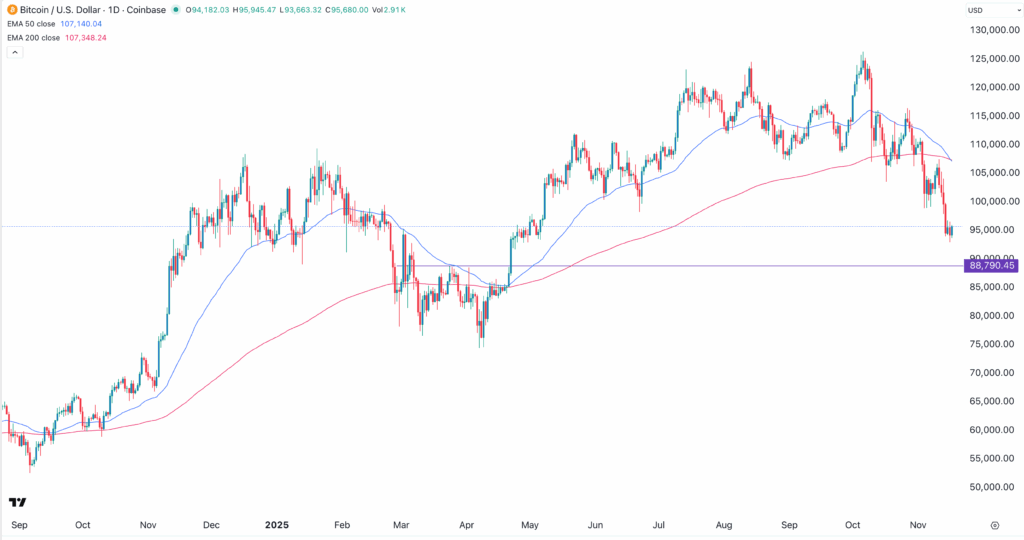
The primary reason why the MSTR stock price may continue to fall is that Bitcoin has maintained its strong downward trend over the past few months.
It has formed a death cross pattern for the first time in over a year. In this case, the 50-day moving average has moved to $107,136, while the 200-day average has dropped to $107,350.
The coin is also forming a bearish flag pattern, characterized by a vertical line and consolidation. This pattern also leads to more downside. If this happens, the next key support level to watch will be at $88,790, the highest level on March 24. This support was also the neckline of the double-bottom pattern at $75,000.
Bitcoin’s performance is notable for Strategy because it is its primary asset. Data show that the company currently owns 641,692 coins, worth over $61 billion. These holdings are now worth more than $61 billion, higher than its market capitalization of $57 billion.
Summary
Strategy stock price has been in a strong downward momentum in the past few months, moving from a high of $545 in November last year to a low of $200 today. While the stock has become highly oversold, there is a likelihood that it will continue falling now that Bitcoin has formed a death cross pattern on the daily chart.