Bitcoin
 ZKsync
 Pudgy Penguins
 Pearl
Pearl Quantus
 Starknet
 NEAR Protocol

Solana price is responding to a group of technical levels that traders are closely monitoring. The market structure is highly compressed, but several analysts see constructive signals forming. The current setup is at a pivot, which is the interaction of inflows, sentiment, and support zones.
Solana Price Holds Resistance Amid Retest
Gordon Gekko believed that Solana price action still charts an early-stage Wyckoff accumulation pattern. His weekly chart has phases A to E with support clusters at $115 and resistance at or near $250. Gekko reported good on-chain activity, and growing ETF inflows support the structure.
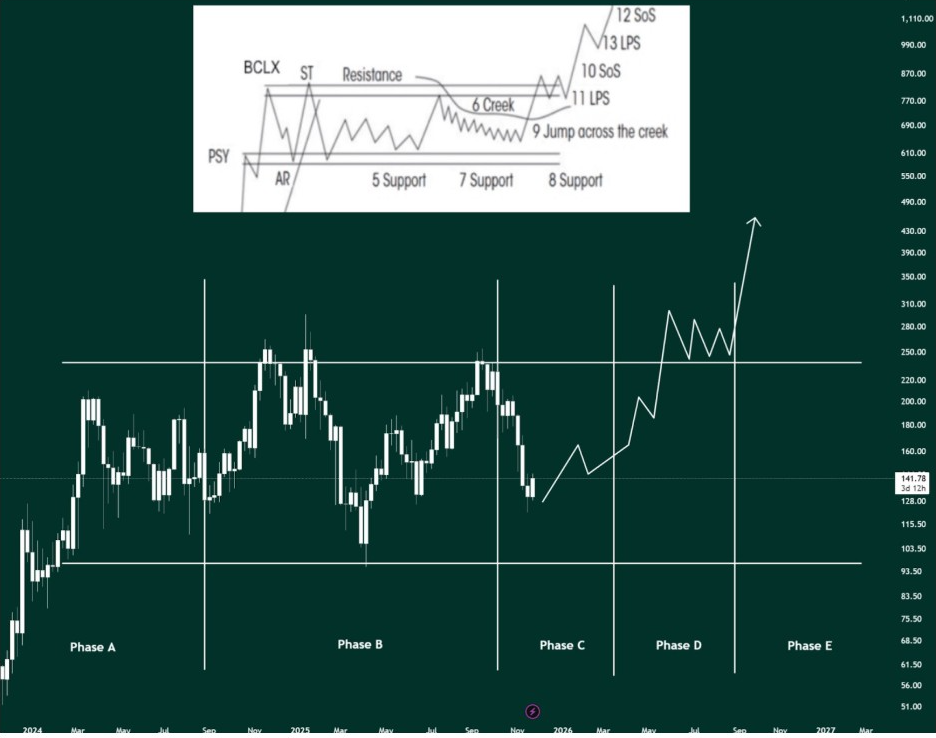
His model described a possible “jump across the creek” when Solana passes through the mid-range. A larger markup phase is projected later by the chart, with the price cycling through Phase D to higher zones. Gekko lists several catalysts, among them are demands for ETFs and liquidity on the broader market.
He added that $500 is still possible by 2026 if the accumulation is complete. For those exploring how blockchain innovations like Solana could integrate with emerging sectors such as online gaming and low-deposit casinos, check out this resource: https://kaszino-radar-magyar.com/alacsony-befizetes-casino/. His view is based on long-term structure, rather than short-term volatility. The Solana price is following the pattern’s key checkpoints well on the weekly chart.
Rising Channel Targets Fresh Upside Extension Soon
Furthermore, analyst FOUR highlighted that Solana is pulling back into major resistance for a retest. His 4-hour chart depicts a rising channel making its way into the $144-$146 supply zone. FOUR says that a successful retest could fuel the next leg up.
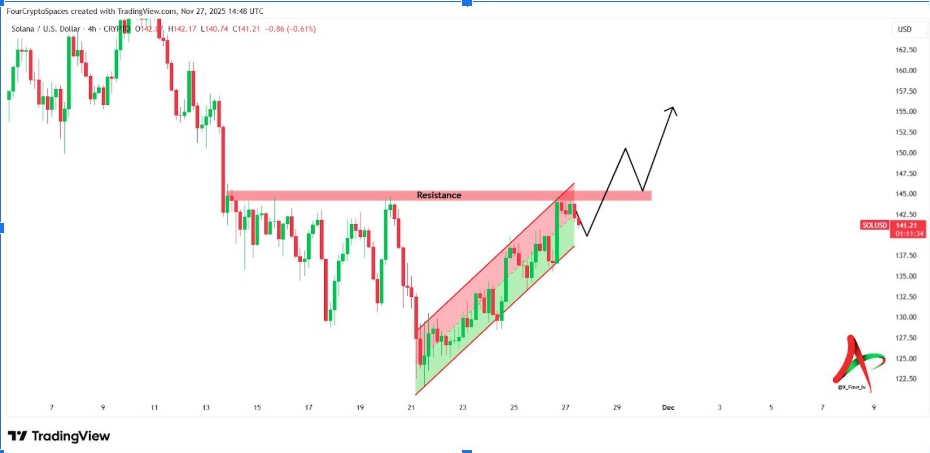
His chart showed a fairly defined breakout pattern should the retest hold. A rejection is still possible, but the channel has been steadily trending lower. FOUR implies watching the retest closely because momentum has cooled on the resistance.
The structure shows Solana’s price attempting to clean up a flip of the zone into support. A confirmed hold position sets up a measured continuation towards the $150s. FOUR emphasized that it is the price reaction at this zone that will determine the short-term direction.
Key Supply Zone Determines Market Direction
Similarly, analyst Mr. APE said Solana’s price is “walking straight into the lions’ den.” He pointed
to the $144-$146 area as a heavy supply that rejected price 3 times. His chart indicates repetitive failure at the same block overhead.
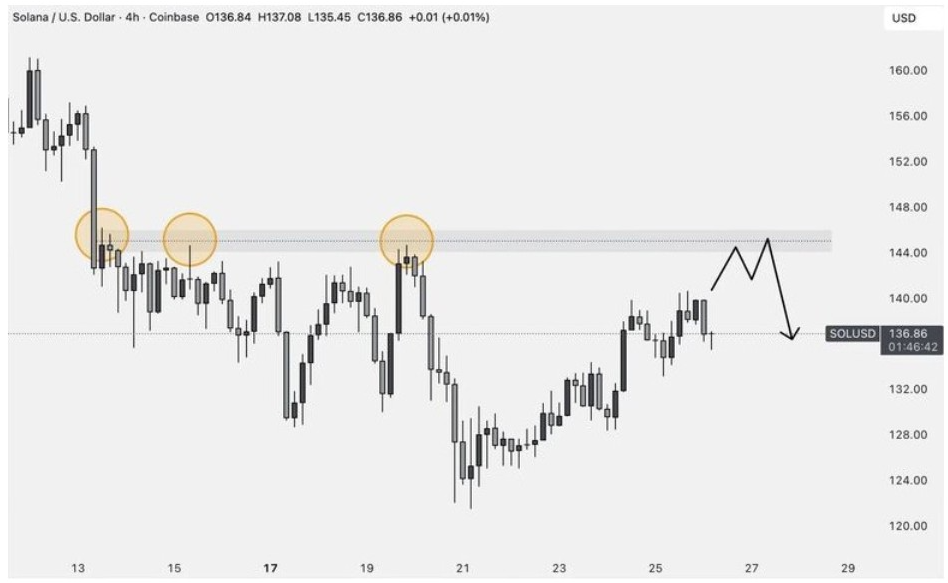
Mr. APE showed support at $132 from the previous bounce. He adds that volume has to verify any shift above resistance. His breakout target is at $157, provided the region flips to support.
A potential structure of chop in the zone before direction can be seen in the chart. Mr. APE said that he only looks long after confirmation of fresh support. The Solana price is thus at a critical pivot, representing the next leg.
Fibonacci Levels and Capitulation Patterns Shape Outlook
Meanwhile, Chiefrat focused on Fibonacci retracement levels on the recent drop. His chart puts the 0.5 level at $146.85 and the 0.618 level at $152.77. He says that these are the levels Solana must regain to regain strength.
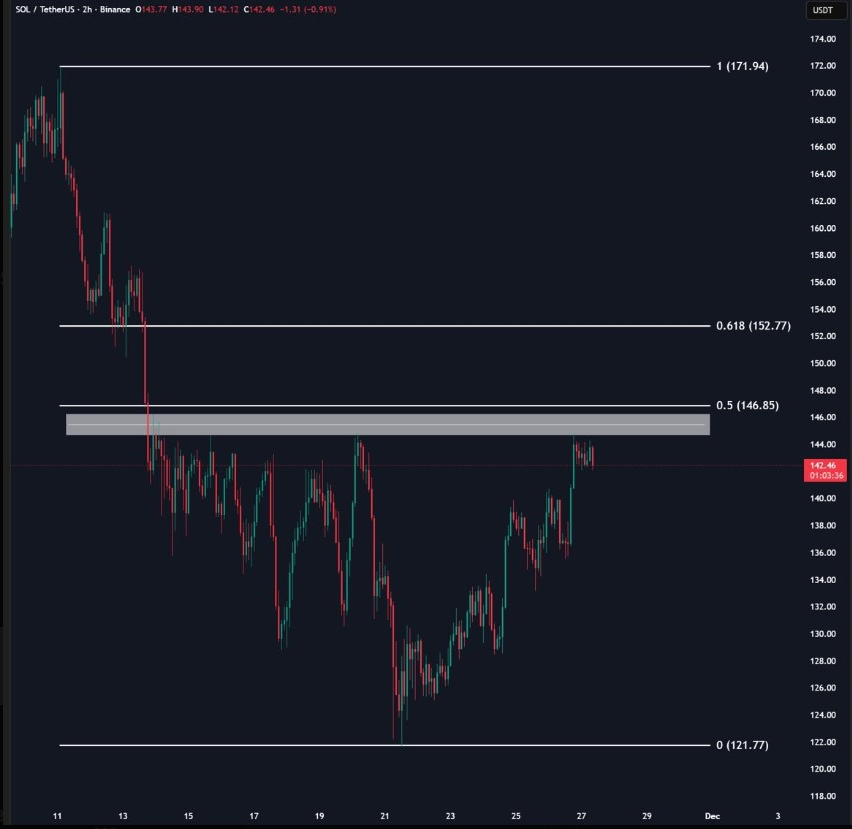
The structure shows a clean rise off $121, but the 0.5 level plays the role of a major resistance. Chiefrat said reclaiming the zone sets up a test of $152.80 next. His higher target remains at $171.94 with a 1.0 extension.
Ali provides an on-chain view based on Solana’s Net Unrealized Profit/Loss metric. He argued Solana has usually bottomed when investors throw in the towel. The NUPL chart shows strong capitulation signals throughout the last two weeks.
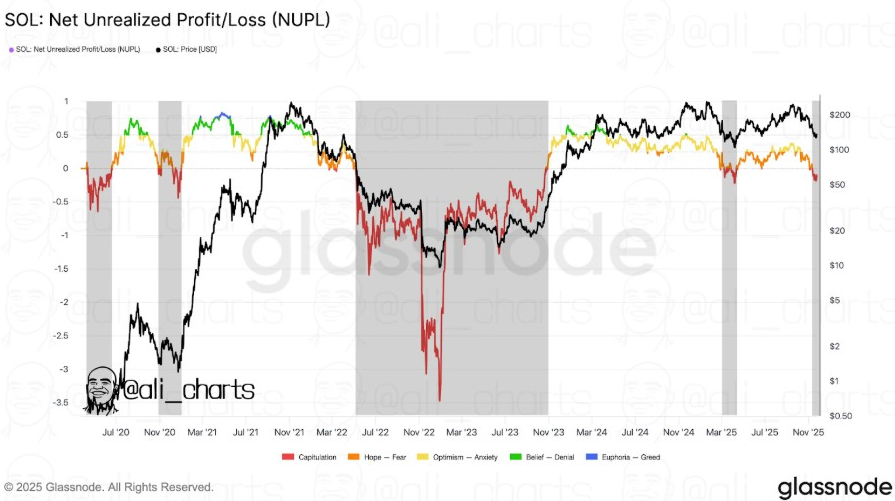
This pattern has been a precursor to great recoveries in the past. Ali says that the market is entering a period of fear. If the pattern repeats, Solana price could build a base for the next phase of expansion.