Universal High Income
 OnlyAgent
 Pearl
 Pudgy Penguins
 Lighter
 Bitcoin
 Quantus

- The Graph price is trading with strong downtrend momentum over the daily chart.
- The crypto asset is trading below 20, 50, 100 and 200-days Daily Moving Average.
- The pair of GRT/BTC is at 0.000004593 BTC with an intraday drop of 4.06%.
The Graph price has been consolidating inside a horizontal range-bound area over the daily price chart and then the token fell below the consolidation phase with strong downtrend momentum. GRT coin is trying to gain support from the bulls as it has been falling significantly. GRT bulls must accumulate themselves to let the token gain support from the current level. GRT coin has been falling due the circumstances of bear market and it fell below the consolidation phase on 11 June.
The Graph price is presently CMP at 0.094 and has lost 11% of its market capitalization in the last 24-hour period. Trading volume has decreased by 32% in the intraday trading session. This shows that GRT is facing peer selling pressure over the chart. Volume to market cap ratio is 0.108.
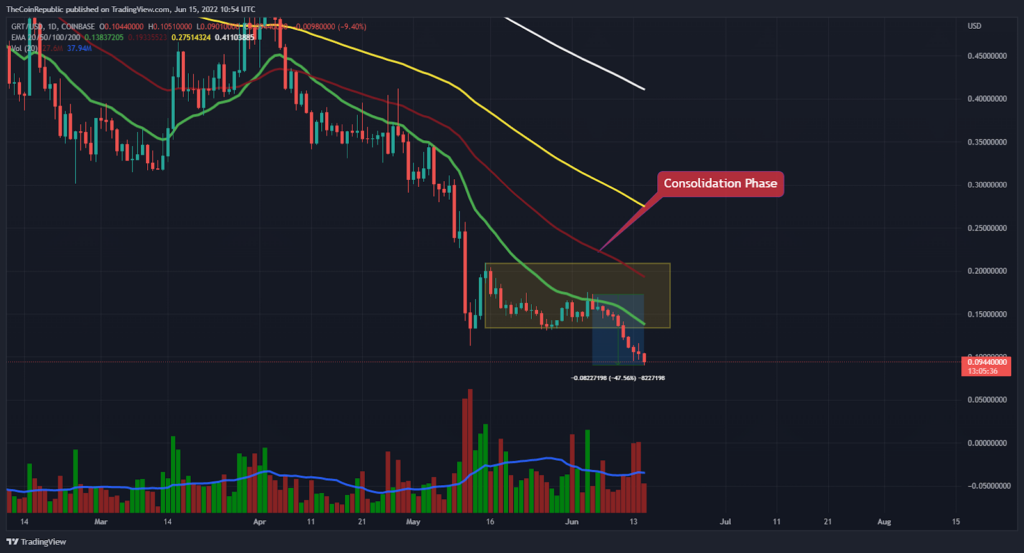
GRT coin price has been falling after being rejected from the horizontal range-bound area. The token must accumulate buyers in order to escape falling more making lower lows. However, volume change can be seen under the influence of bears and signifies the downtrend momentum of GRT coin.
What do Technical Indicators Suggest about GRT?
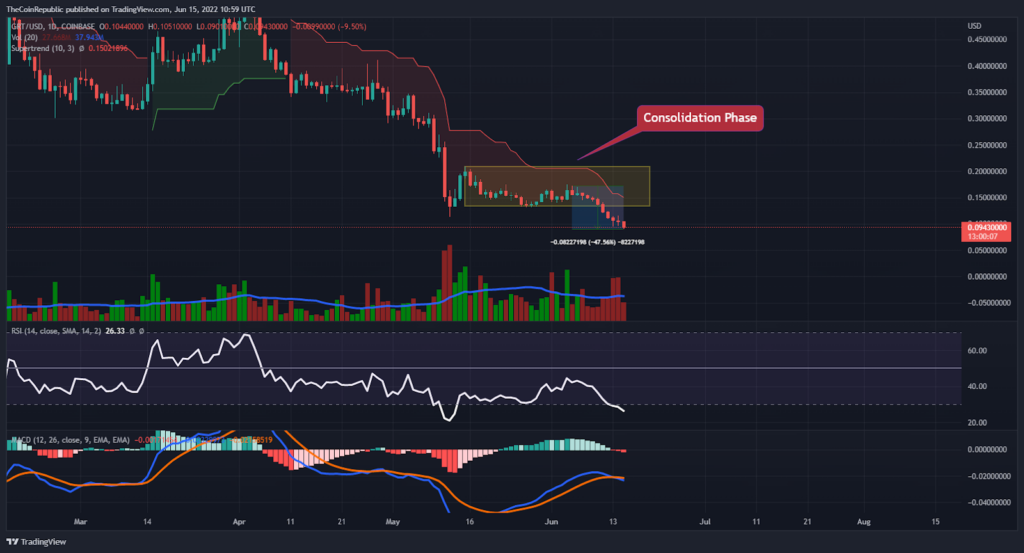
GRT coin price has been falling through a bearish rally and is currently trading with storing downtrend momentum over the daily chart. The token is trying to get support from the bulls and bulls need to come forward to execute the rescue plan for GRT. However, technical indicators suggest that GRT is being oversold at the moment. Moreover, Supertrend showcases the bearish rally of GRT coin. Relative Strength Index forecast GRT inside the oversold territory. RSI is presently at 26 and GRT is heading towards the extreme oversold zone.
MACD exhibits the downtrend momentum of the GRT coin. The MACD line is below the signal line after a negative crossover. GRT investors need to wait for any directional change over the daily price chart.
Conclusion
The Graph price has been consolidating inside a horizontal range-bound area over the daily price chart and then the token fell below the consolidation phase with strong downtrend momentum. However, technical indicators suggest that GRT is being oversold at the moment. Supertrend showcases the bearish rally of GRT coin. GRT investors need to wait for any directional change over the daily price chart.
Disclaimer
The views and opinions stated by the author, or any people named in this article, are for informational ideas only, and they do not establish the financial, investment, or other advice. Investing in or trading crypto assets comes with a risk of financial loss.