Universal High Income
 Dacity Coin
 OnlyAgent
 Pearl
 NEAR Protocol
 Bitcoin
 Pudgy Penguins

- Flow price prediction suggests a rise in the long term but a price drop is in the cards over the next 7 days.
- Flow price is trading below the 200 day EMA and is struggling to hold the 50 day EMA.
- Flow crypto price is down by 13.89% for the month of March.
FLOW price prediction favors the bulls and suggests short term relief rally is possible from the lower levels. Flow price is forming a double bottom bullish reversal pattern but confirmation of the trend reversal is still awaited. However, if we look at the bigger picture, then the price is below the 200 day EMA showcase downtrend on the positional basis. Flow crypto price recovered about 20% from the recent low swing but the momentum halted at $1.200 and got stuck into consolidation range.
Flow price is trading at $0.998 with an intraday decline of -1.29% and 24 hour volume to market cap ratio at 0.0619. The FLOW/BTC pair is trading at 0.00003608 with an intraday rise of 0.50% showing divergence between direction of both the pairs. In mid-February, Flow price attempted to break the $1.400 hurdle but failed and prices faced rejection from the higher levels.
Flow price began to decline by forming lower lows and dropped below the 50 day EMA, inviting further selloff. Moreover, the sell off in the global market also negatively impacted the majority of altcoins prices.
Will Flow Price Recover From The Demand Zone?
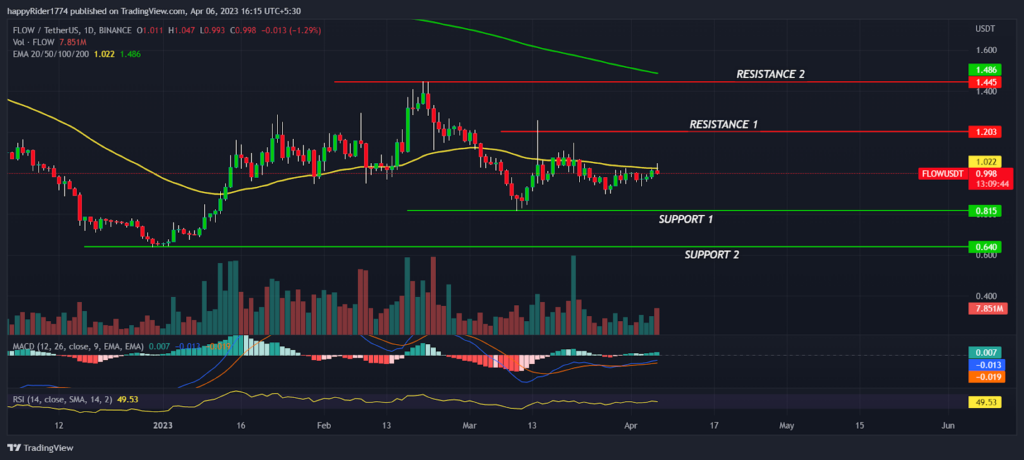
FLOW price hit the low swing at $0.814 and formed a bullish hammer candle pattern showing responsive buyers are active at lower levels. The trading volume in the Flow crypto is on the rise and sudden spikes in volumes are very common for the coin. It indicates that whales and retail segments both participate, and minor speculative activities are also there.
Technical analysis suggests the probability of a sharp recovery is low. However, if the Flow price holds $1.00, then we might see some sort of relief rally from the lower levels. On the other hand, if the price drops below $0.800, then the bears might try to drag it down toward yearly lows.
Flow Price on Weekly Timeframe
FLOW price forming a Doji candle pattern over the past few weeks shows prices are lacking clear direction. However, if the prices consolidate for a few months, then it can be interpreted as a long term base formation. If the overall market sentiment remains bullish, the possibility of upward range expansion will also increase. Technical indicators like MACD had generated a positive crossover indicating mild bullishness. The RSI, 50 at neutral territory denotes equal level of tug of war between buyers and sellers.
Conclusion
Flow price prediction suggests a short term relief rally is possible from the lower levels. However, if the price drops below $0.800 then it may create trouble for the bullish traders. Technical analysis suggests the probability of a sharp rebound is low and prices might consolidate for some more time.
Technical levels
Resistance levels : $0.1200 and $0.1445
Support levels : $0.800 and $0.640
Disclaimer
The views and opinions stated by the author, or any people named in this article, are for informational purposes only, and they do not establish financial, investment, or other advice. Investing in or trading crypto assets comes with a risk of financial loss.